9 Publication Figures
The sa-publication-figures module assembles individual analysis plots into multi-panel figures suitable for journal submission. All figures meet standard publication requirements: 300 DPI resolution, colorblind-safe palettes, and consistent typography.
9.1 Figure Standards
| Parameter | Value |
|---|---|
| Resolution | 300 DPI (minimum for print) |
| Colour palette | ggsci::scale_color_lancet() (colorblind-safe) |
| Font | Arial or Helvetica, 8–12 pt |
| Line width | 0.5–1.0 pt |
| Panel labels | Uppercase letters (A, B, C, …) |
| Export formats | PNG, PDF, TIFF |
9.2 Theme Setup
The pipeline uses a consistent ggplot2 theme across all figures:
library(ggplot2)

theme_publication <- theme_bw(base_size = 11) +
  theme(
    panel.grid.minor = element_blank(),
    strip.background = element_rect(fill = "grey95"),
    legend.position = "bottom",
    plot.title = element_text(size = 12, face = "bold")
  )

theme_set(theme_publication)
9.3 Multi-Panel Assembly with patchwork
Individual plots are combined into composite figures using the patchwork package:
library(patchwork)

figure1 <- (km_plot | forest_plot) /
            (residual_plot | calibration_plot) +
  plot_annotation(tag_levels = "A") +
  plot_layout(heights = c(1, 1))

ggsave("figure1.png", figure1,
width = 180, height = 160, units = "mm", dpi = 300)Most journals accept figures at 85 mm (single column) or 180 mm (double column) width. The pipeline defaults to 180 mm for multi-panel figures.
9.4 Export Formats
Each figure is saved in three formats:
# PNG for screen/web
ggsave("figure1.png", figure1, width = 180, height = 160, units = "mm", dpi = 300)

# PDF for vector graphics
ggsave("figure1.pdf", figure1, width = 180, height = 160, units = "mm")

# TIFF for some journal requirements
ggsave("figure1.tiff", figure1, width = 180, height = 160, units = "mm",
dpi = 300, compression = "lzw")All figures are written to projects/<name>/04_figures/. The manuscript module references them from this directory during Quarto rendering.
9.5 Running the Module
make figures PROJECT=my-studyThis executes all scripts in sa-publication-figures/scripts/ in order.
9.6 Demo: Publication Figures (Scenario 1)
The demo-standard project generated the following publication-ready figures. Each was exported at 300 DPI in PNG, PDF, and TIFF formats.
9.6.1 Figure Inventory
demo-standard/04_figures/
| Figure | PNG | TIFF | DPI | Description | |
|---|---|---|---|---|---|
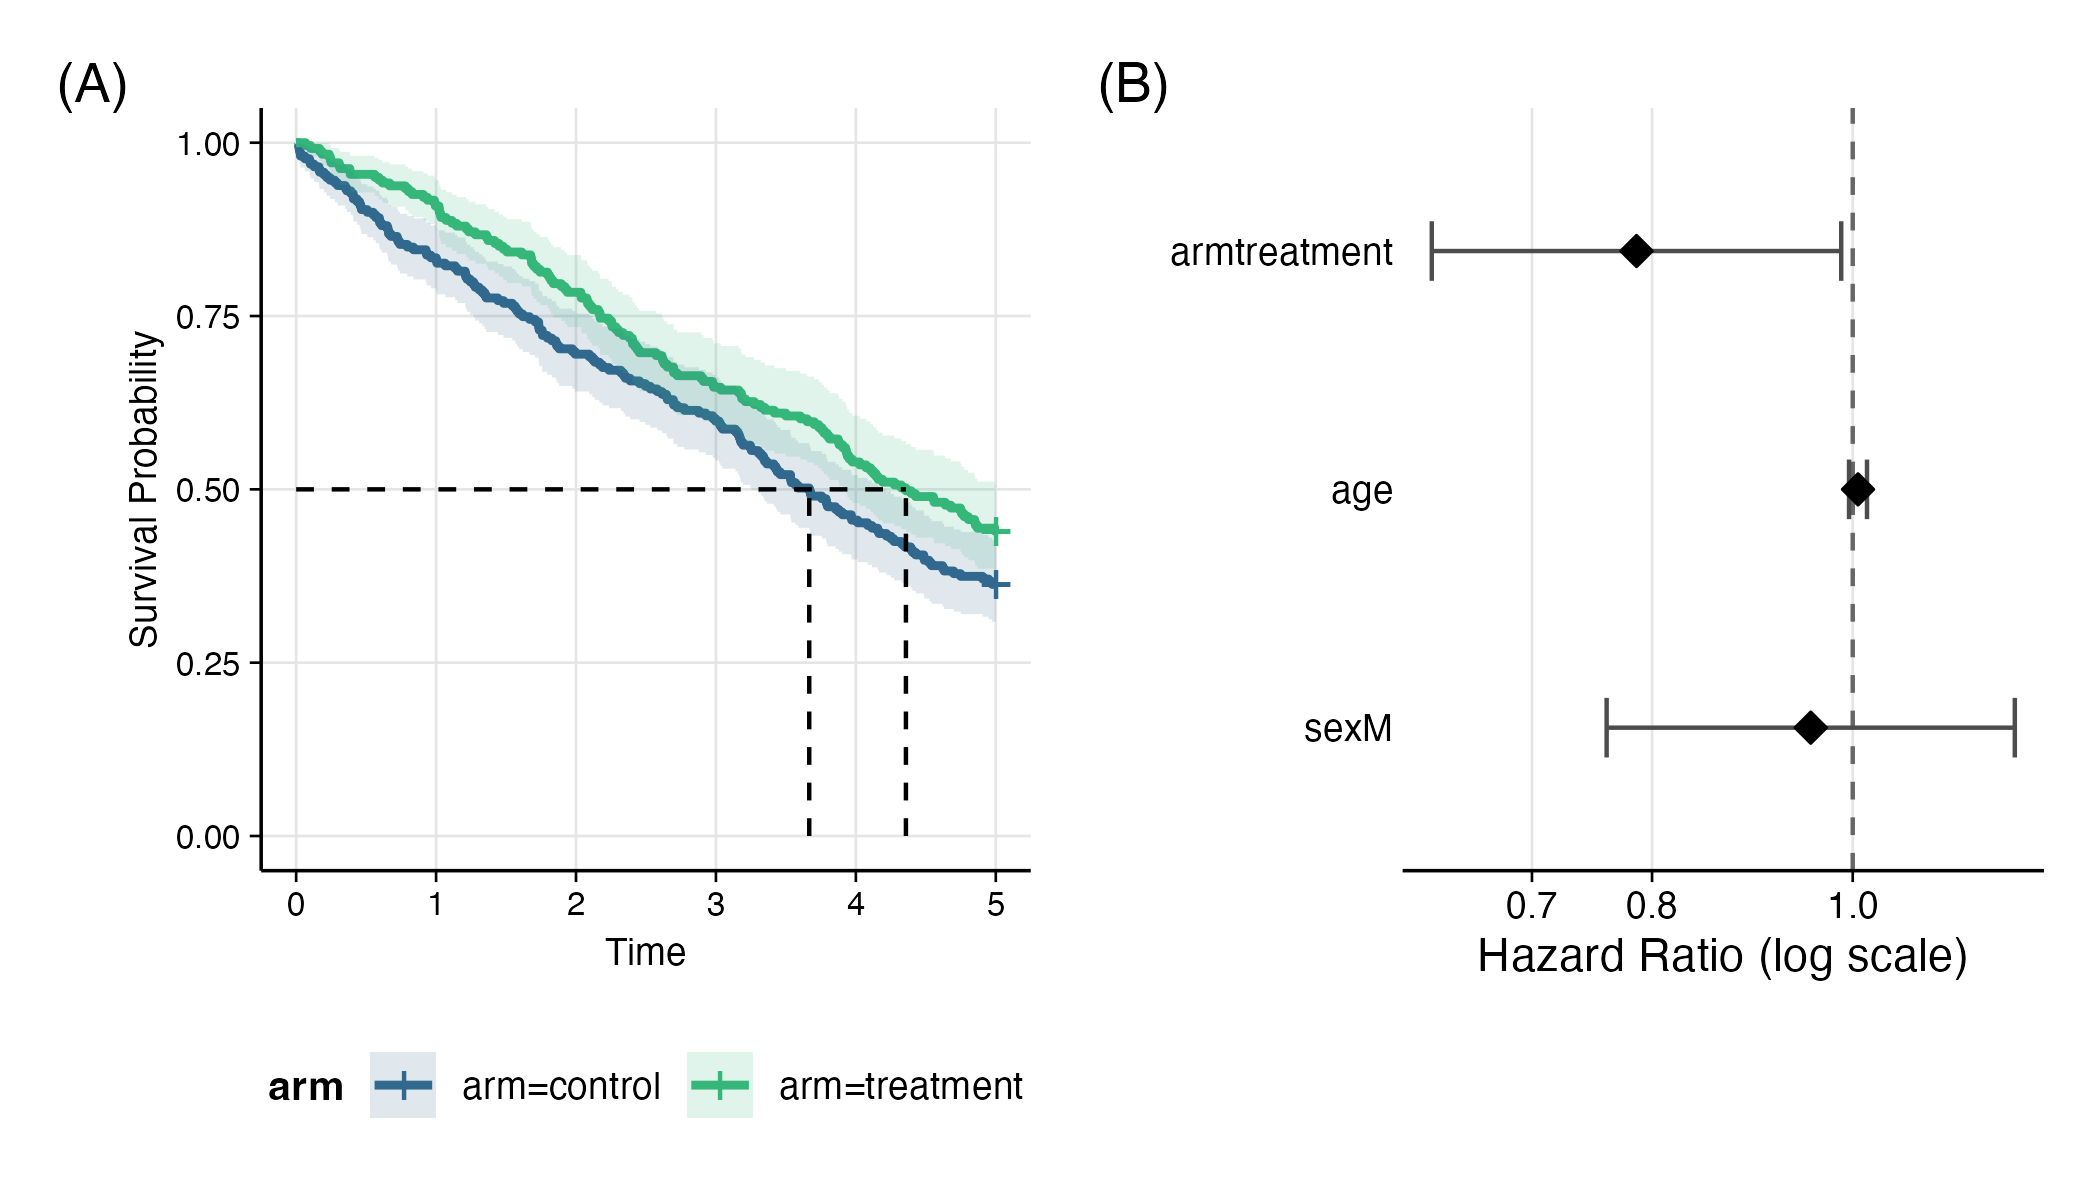
| Figure1_km_survival | Y | Y | Y | 300 | Kaplan-Meier survival curves with risk table and median annotation |
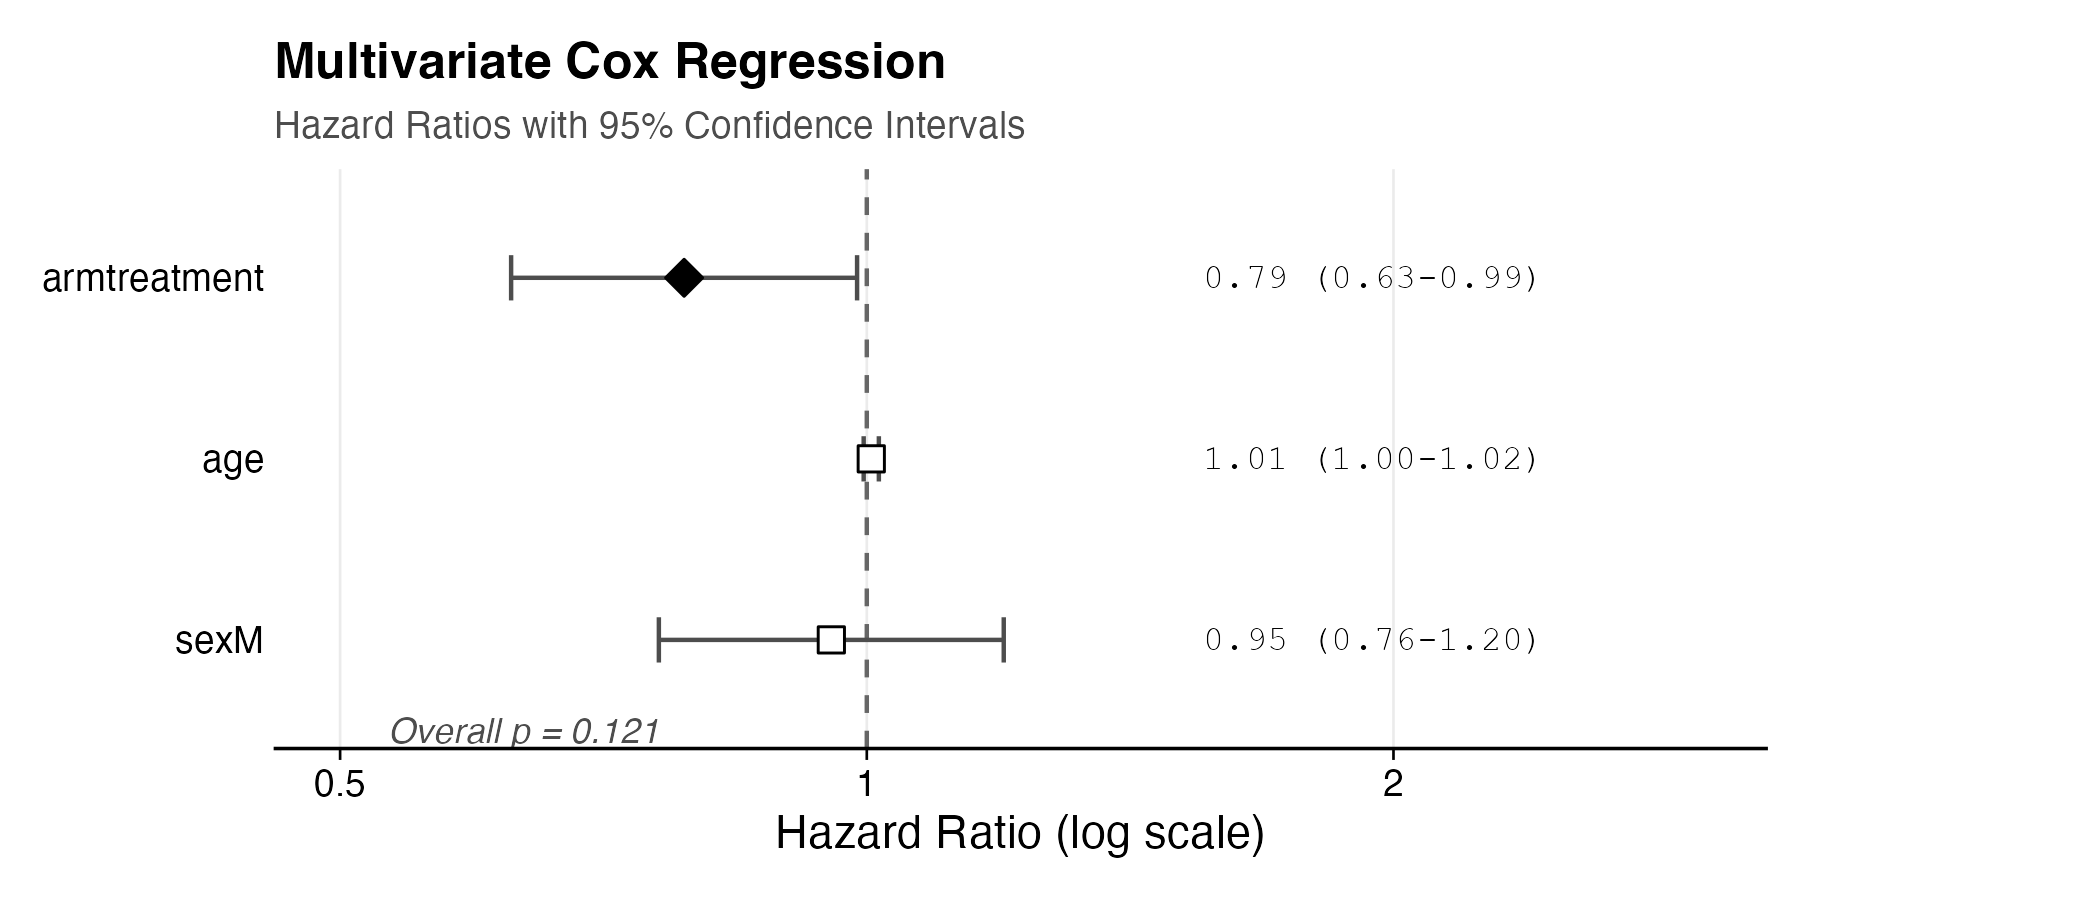
| Figure2_forest_plot | Y | Y | Y | 300 | Forest plot of hazard ratios from Cox regression |
| Figure_combined_panels | Y | Y | Y | 300 | Multi-panel composite figure combining all main analyses |
| FigureS1_diagnostics | Y | Y | Y | 300 | Supplementary: Schoenfeld and Martingale residual diagnostics |
9.6.2 KM Survival Figure

9.6.3 Forest Plot
9.6.4 Multi-Panel Assembly
All figures are exported at 300 DPI in PNG, PDF, and TIFF formats — ready for journal submission.