8 Advanced Adjustments
When the diagnostic engine flags left truncation, informative censoring, or clustering — possibly in combination with other complexities — this module applies the appropriate corrections. These adjustments layer on top of the primary analysis module.
8.1 Script Pipeline
| Script | Purpose |
|---|---|
01_left_truncation.R |
Delayed entry adjustment |
02_ipcw.R |
Inverse probability of censoring weights |
03_frailty_models.R |
Shared frailty for clustered data |
04_cluster_robust_se.R |
Cluster-robust sandwich standard errors |
05_combined_adjustments.R |
Apply multiple corrections simultaneously |
8.2 Left Truncation
Subjects who enter observation after time zero (delayed entry) must be handled with left-truncated likelihoods. The standard Surv() call extends naturally:
# entry_time = time of study entry (left truncation point)
# time = event/censoring time
fit <- coxph(Surv(entry_time, time, status) ~ group + age, data = df)Prevalent cohort studies (enrolling patients who already have the condition), studies using calendar-time scales, and registries where subjects are only observable once they enter the system.
8.3 IPCW for Informative Censoring
When censoring is non-random (sicker patients are more likely to drop out), inverse probability of censoring weights (IPCW) correct for the selection bias:
# Step 1: Model the censoring mechanism
cens_model <- coxph(Surv(time, 1 - status) ~ age + comorbidity, data = df)

# Step 2: Compute weights
df$ipcw <- 1 / predict(cens_model, type = "survival")

# Step 3: Fit weighted Cox model
coxph(Surv(time, status) ~ group + age, data = df, weights = ipcw)IPCW weights can become extreme when the censoring probability approaches zero. Truncate or stabilise weights to avoid high-variance estimates.
8.4 Frailty Models vs Cluster-Robust SE
For clustered data (patients within hospitals, siblings within families), two approaches are available:
| Approach | What It Does | When to Prefer |
|---|---|---|
| Shared frailty | Random effect per cluster | When heterogeneity is of interest |
| Cluster-robust SE | Sandwich variance estimator | When only adjusting for correlation |
# Frailty
coxph(Surv(time, status) ~ group + age + frailty(hospital_id), data = df)

# Cluster-robust SE
coxph(Surv(time, status) ~ group + age + cluster(hospital_id), data = df)
8.5 Combining Adjustments
Script 05_combined_adjustments.R handles cases where multiple complications co-exist — for example, left truncation with clustering:
coxph(
  Surv(entry_time, time, status) ~ group + age + cluster(hospital_id),
  data = df
)The diagnostic report specifies which adjustments are needed. The combined script reads this report and applies only the flagged corrections, avoiding unnecessary complexity.
8.6 Running the Module
make analyze-advanced PROJECT=my-study8.7 Demo: Kitchen Sink (Scenario 6)
N=1000, 15 centers, 15.8% left truncated, informative censoring, ICC approximately 0.05.
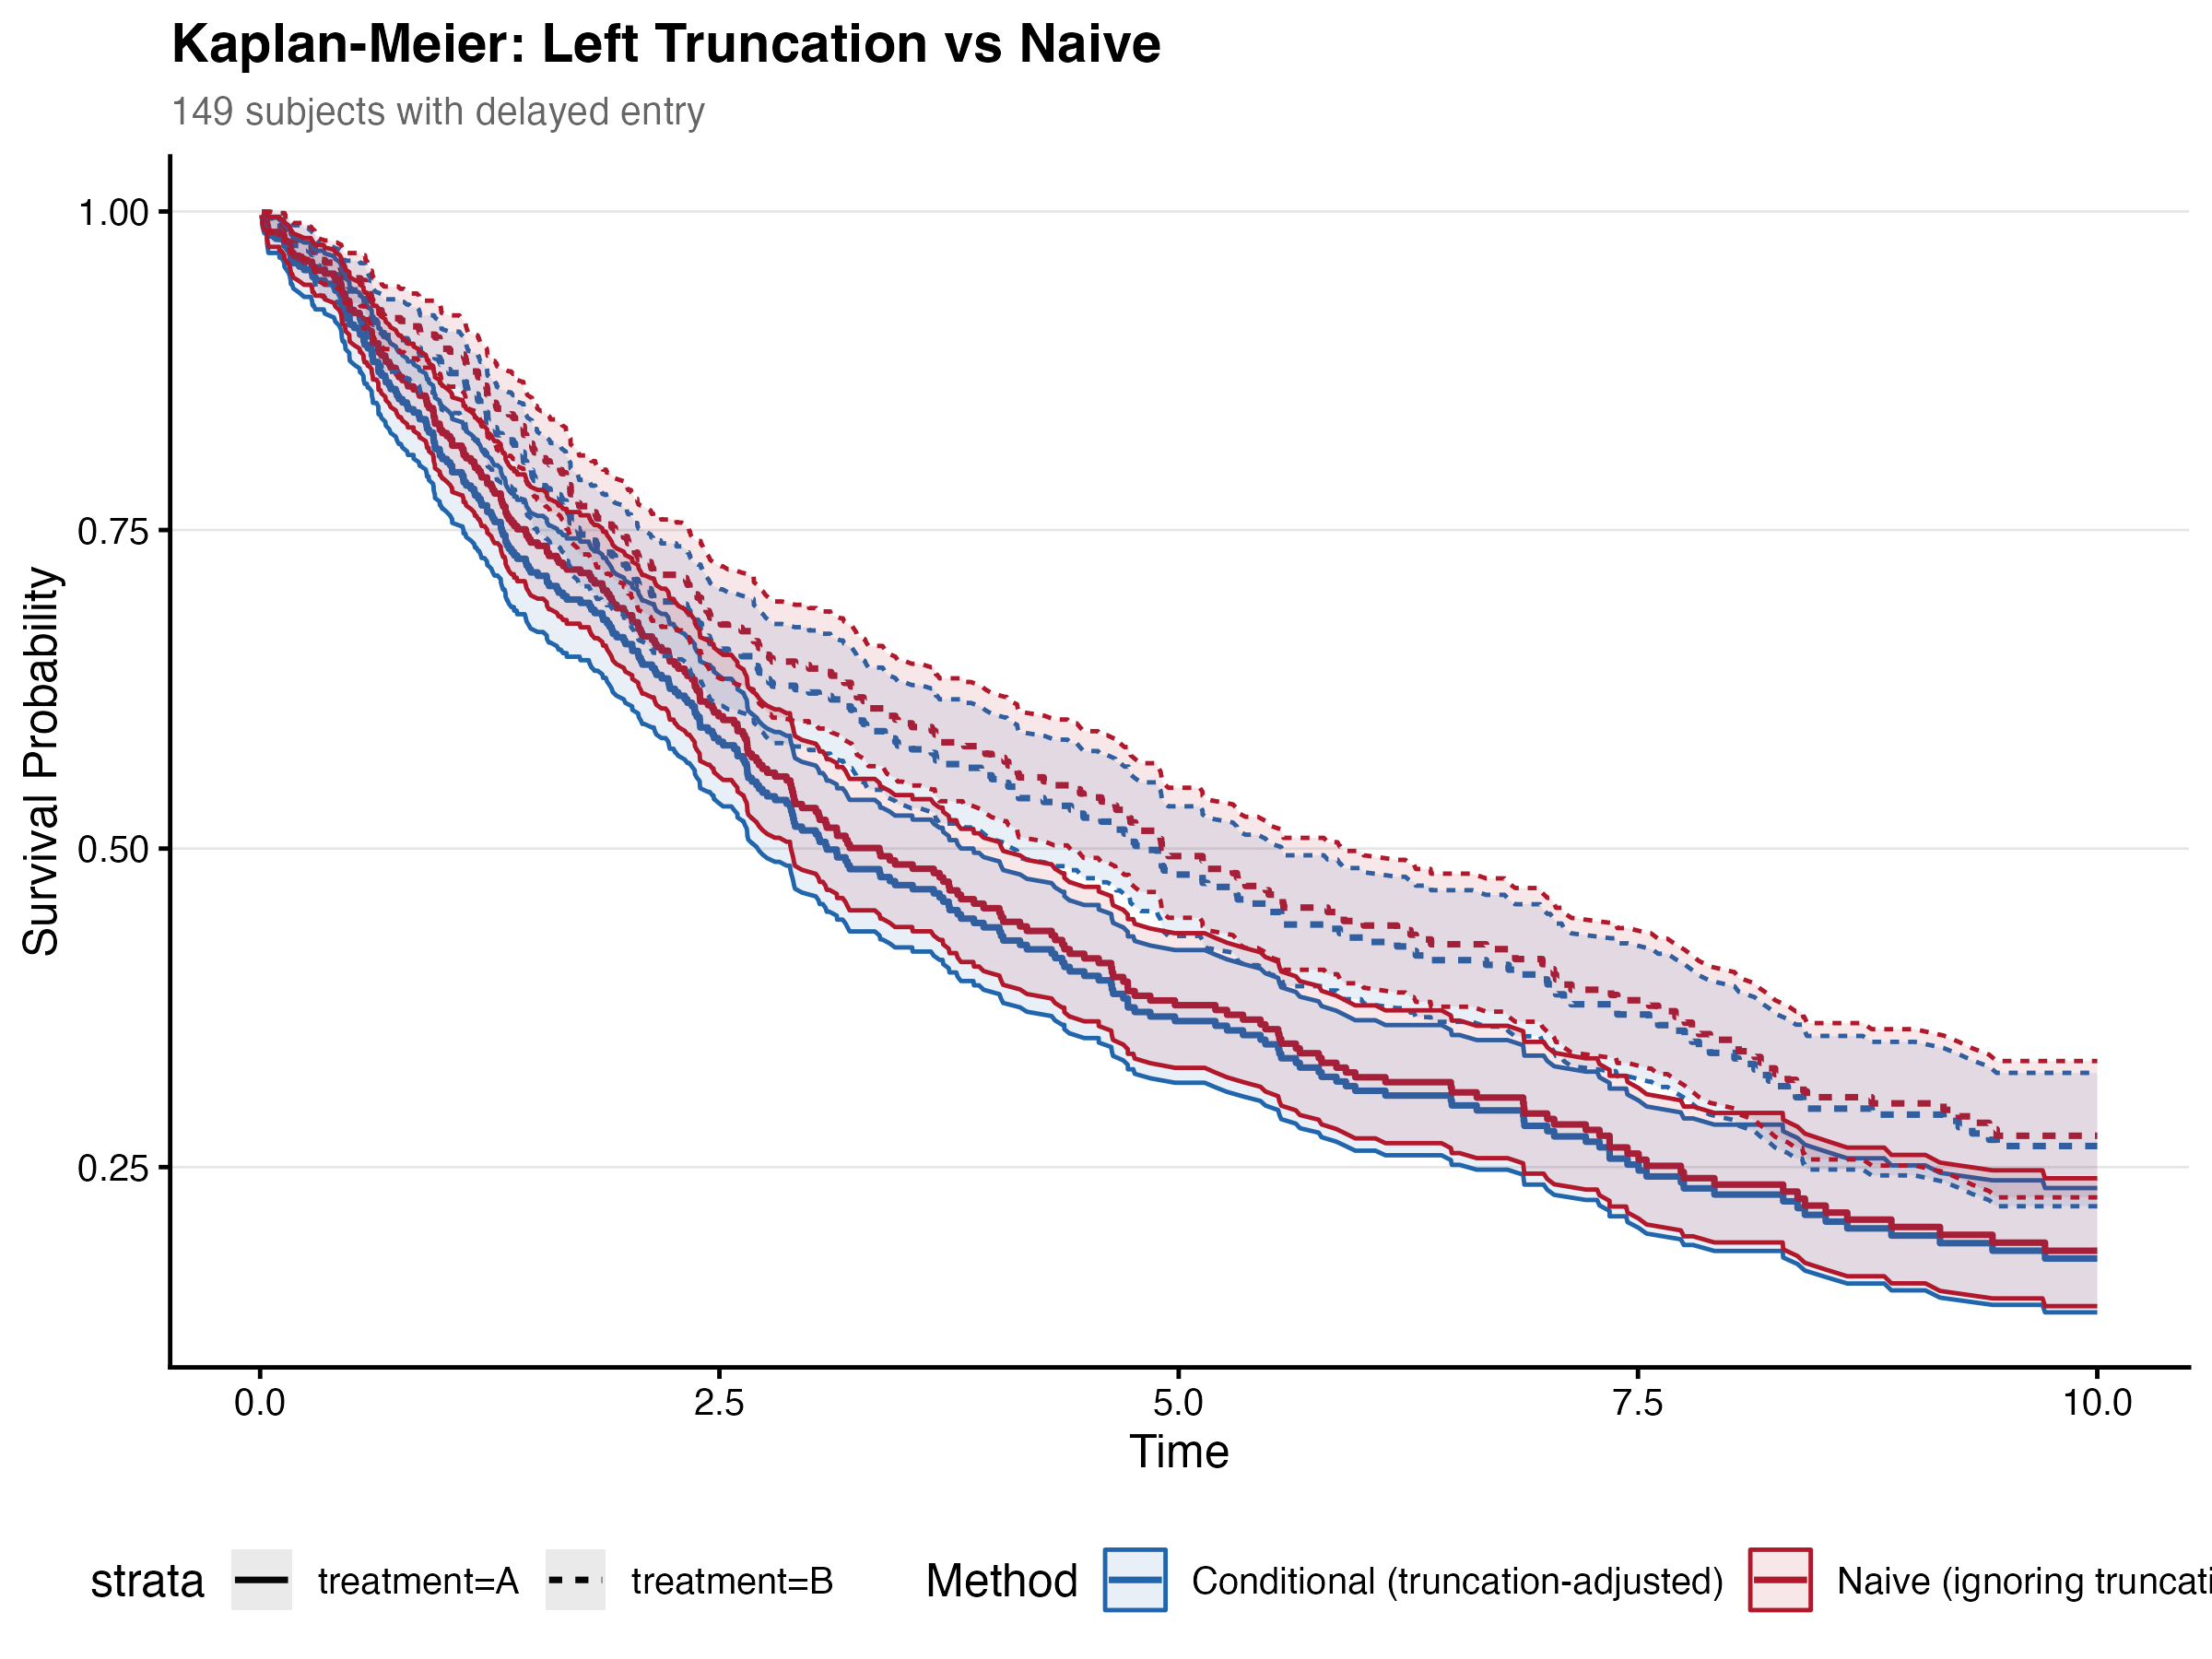
8.7.1 Left Truncation
Adjusting for delayed entry had modest effects on the severity HR. The truncation-adjusted model estimated severity HR = 1.707, compared to the naive HR = 1.723 — a -0.89% change. Center and age estimates were essentially unchanged.
| Variable | HR (truncated) | HR (naive) | % change |
|---|---|---|---|
| Center | 1.010 | 1.012 | -0.15% |
| Age | 1.002 | 1.001 | +0.02% |
| Severity | 1.707 | 1.723 | -0.89% |
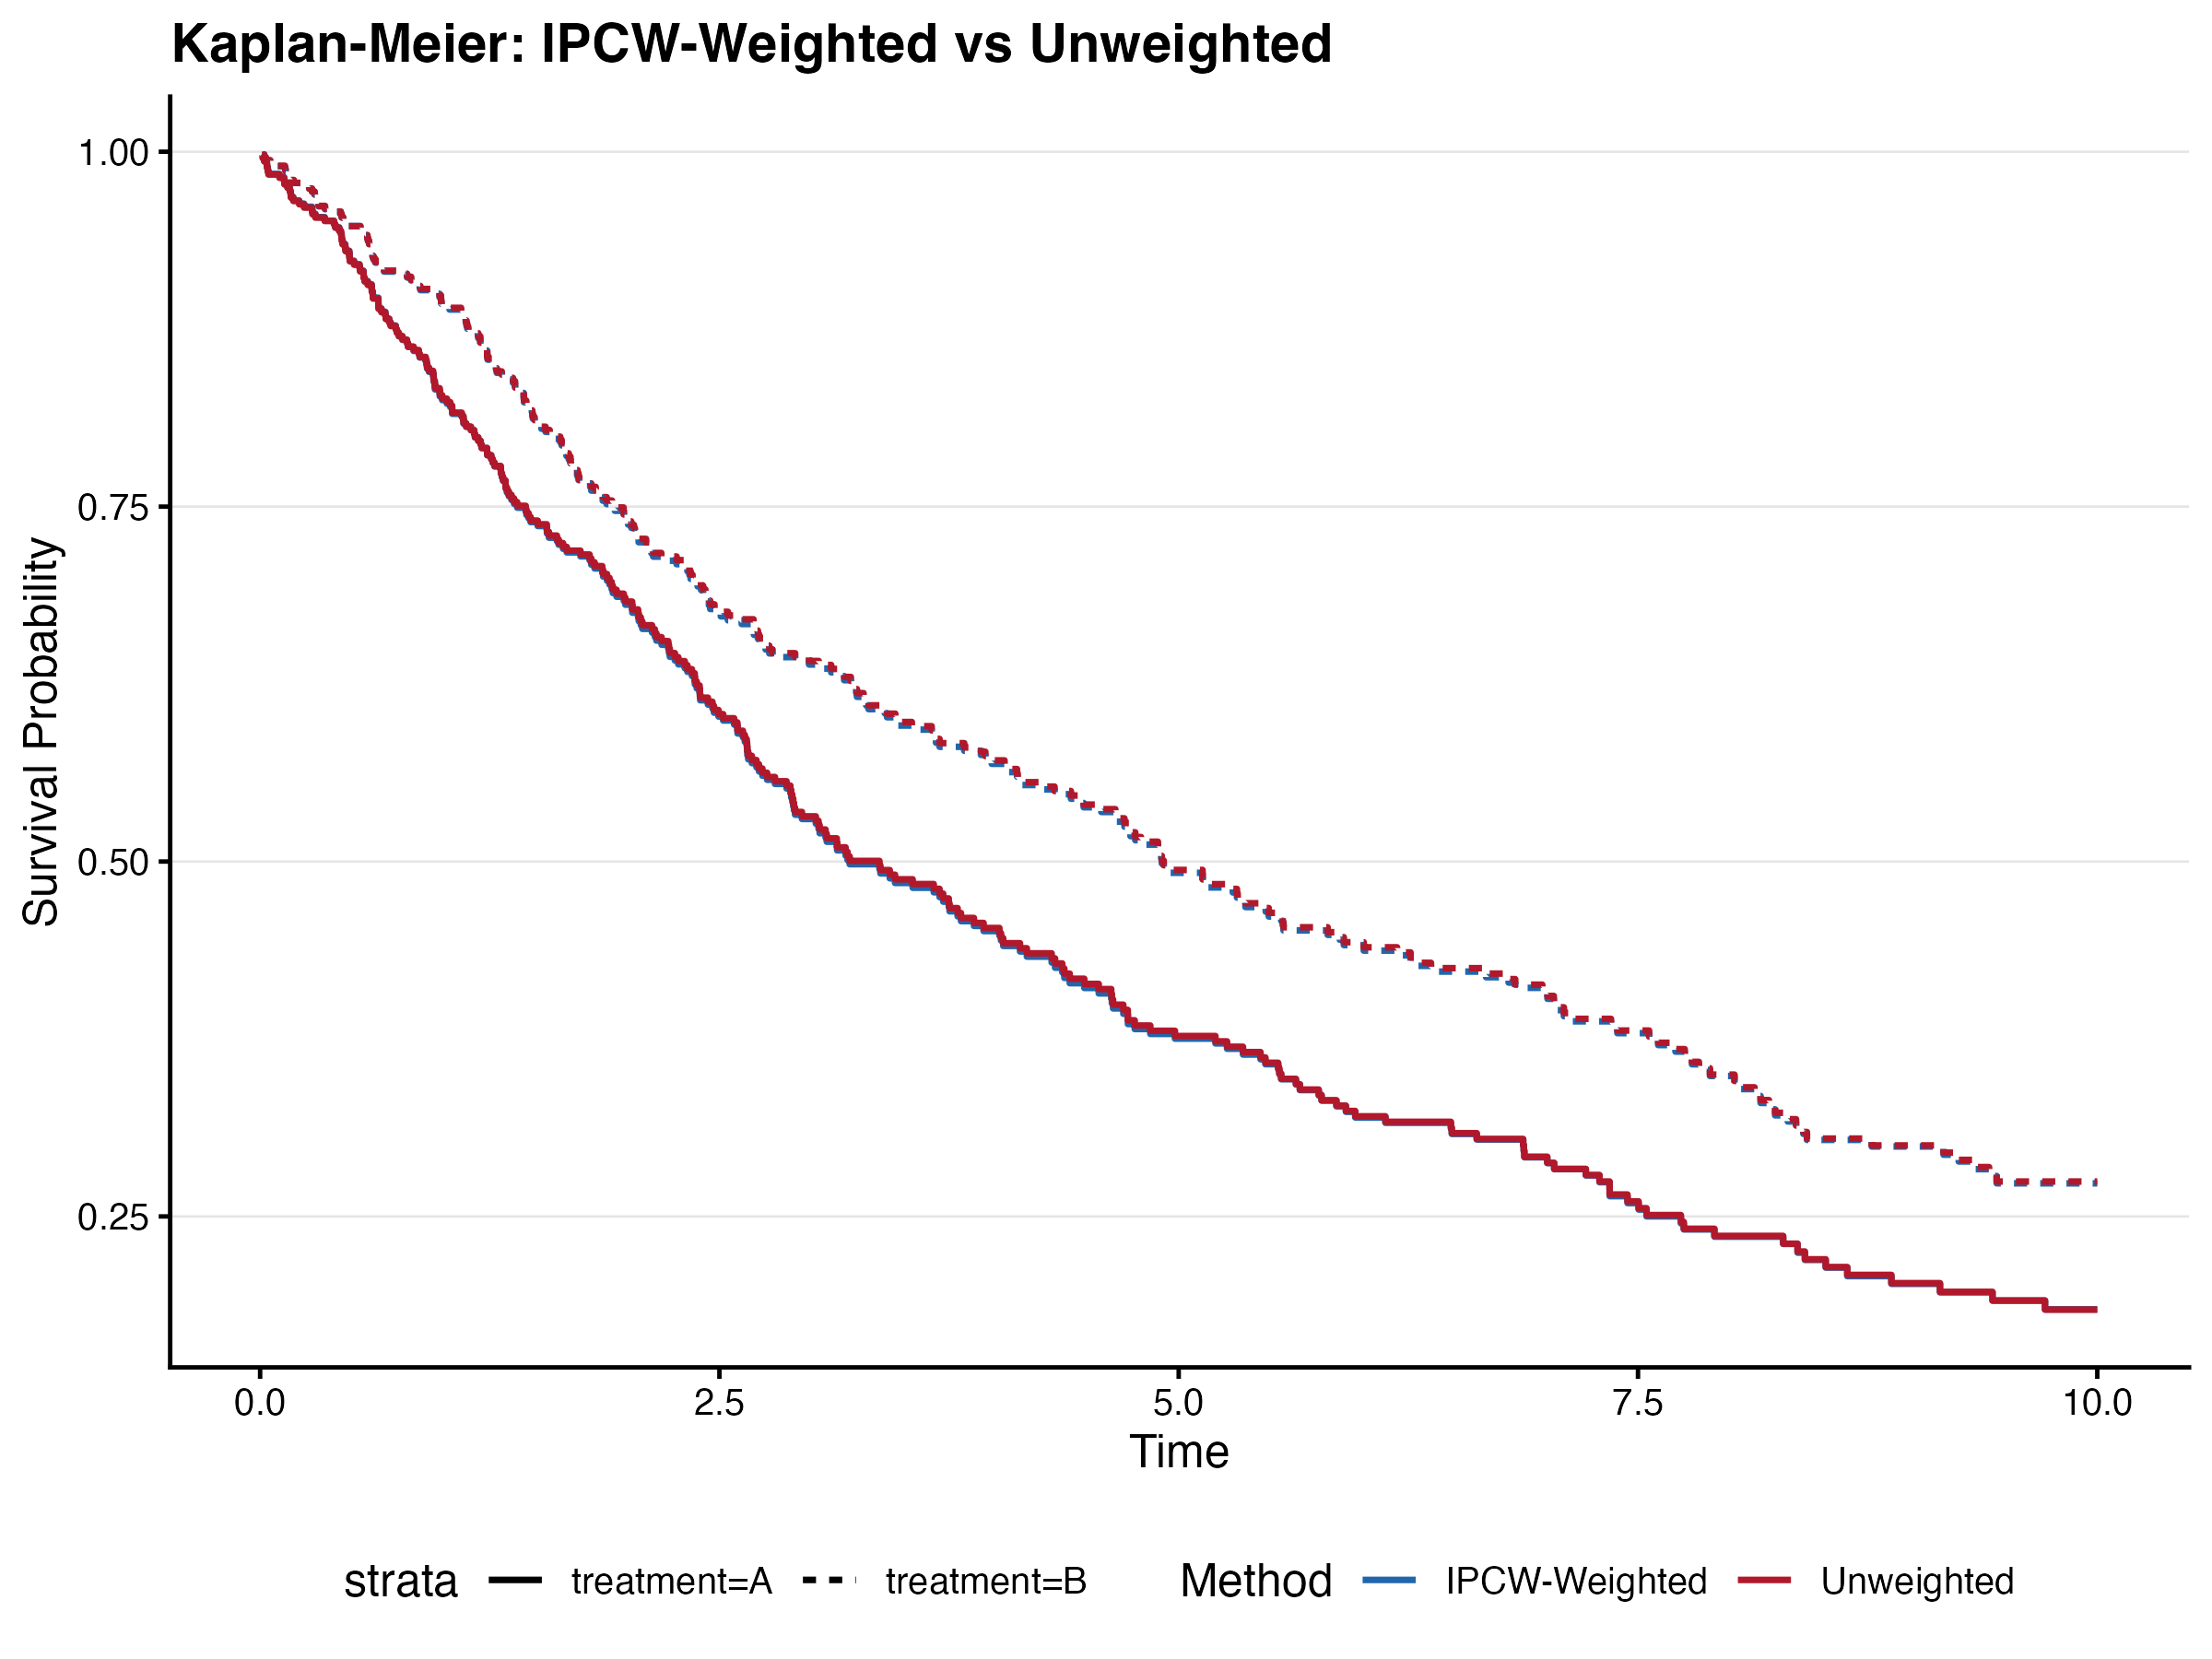
8.7.2 IPCW Weighting
8.7.3 Frailty (Clustering)
The shared frailty model (coxme) estimated a center-level frailty variance of 0.187, corresponding to a moderate degree of between-center heterogeneity. Using robust sandwich SEs, the severity SE decreased from 0.152 (naive) to 0.126 (robust), a ratio of 0.83, indicating that ignoring clustering slightly inflated standard errors in this case.
| Variable | HR (fixed) | HR (frailty) | Frailty variance |
|---|---|---|---|
| Age | 1.002 | 1.001 | 0.187 |
| Severity | 1.726 | 1.819 | 0.187 |
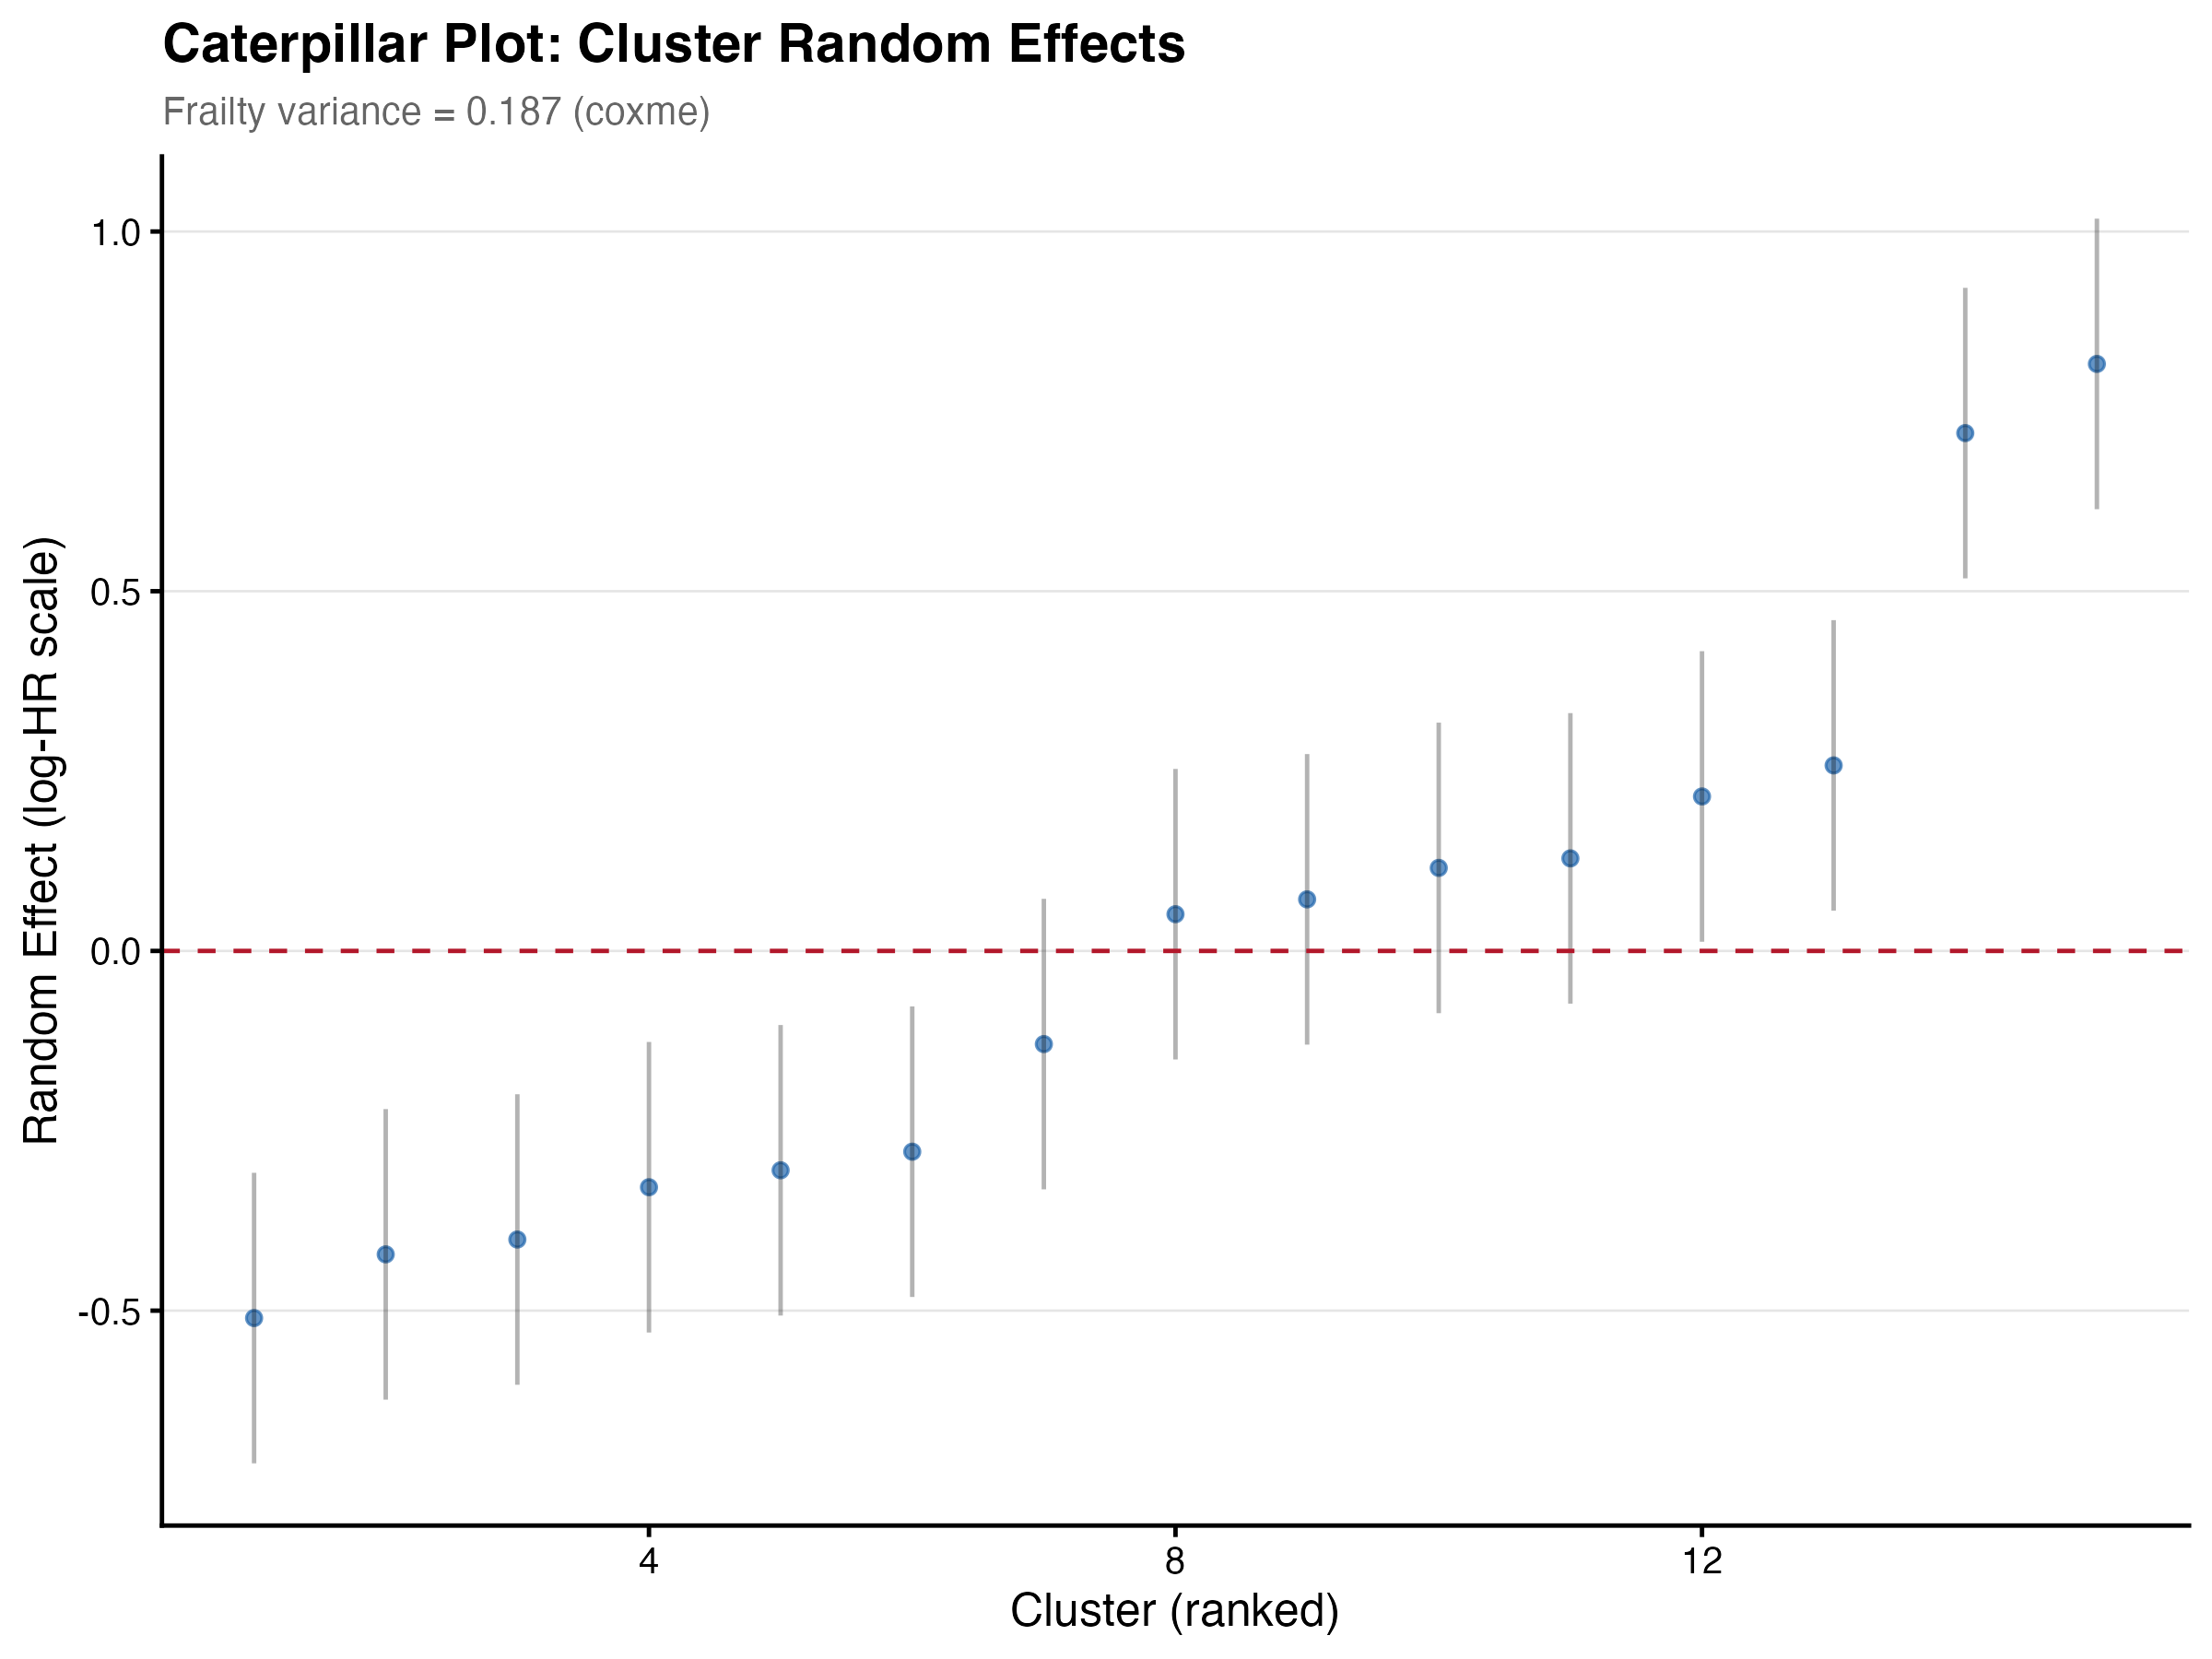
The frailty model had the largest impact: severity HR shifted from 1.726 (fixed-effects) to 1.819 (frailty-adjusted), a ~5.4% increase. Center-level random effects ranged from HR=0.60 to HR=2.26.