4 Standard KM + Cox
When the diagnostic engine detects no competing risks, recurrent events, or time-varying exposures, the pipeline routes to the standard Kaplan-Meier and Cox regression module. This is the most common analysis path.
4.1 When to Use
This module is appropriate when:
- There is a single event type (e.g., death or relapse)
- Each subject contributes one observation
- Exposure/treatment is fixed at baseline
- No significant clustering or left truncation
4.2 Script Pipeline
| Script | Purpose |
|---|---|
01_km_curves.R |
Kaplan-Meier survival curves with survfit |
02_logrank_tests.R |
Log-rank and stratified log-rank tests |
03_cox_ph.R |
Univariable and multivariable Cox PH models |
04_ph_diagnostics.R |
Proportional hazards assumption testing |
05_model_diagnostics.R |
Residual plots, influential observations |
06_sensitivity.R |
Subgroup analyses and robustness checks |
4.3 Kaplan-Meier Curves
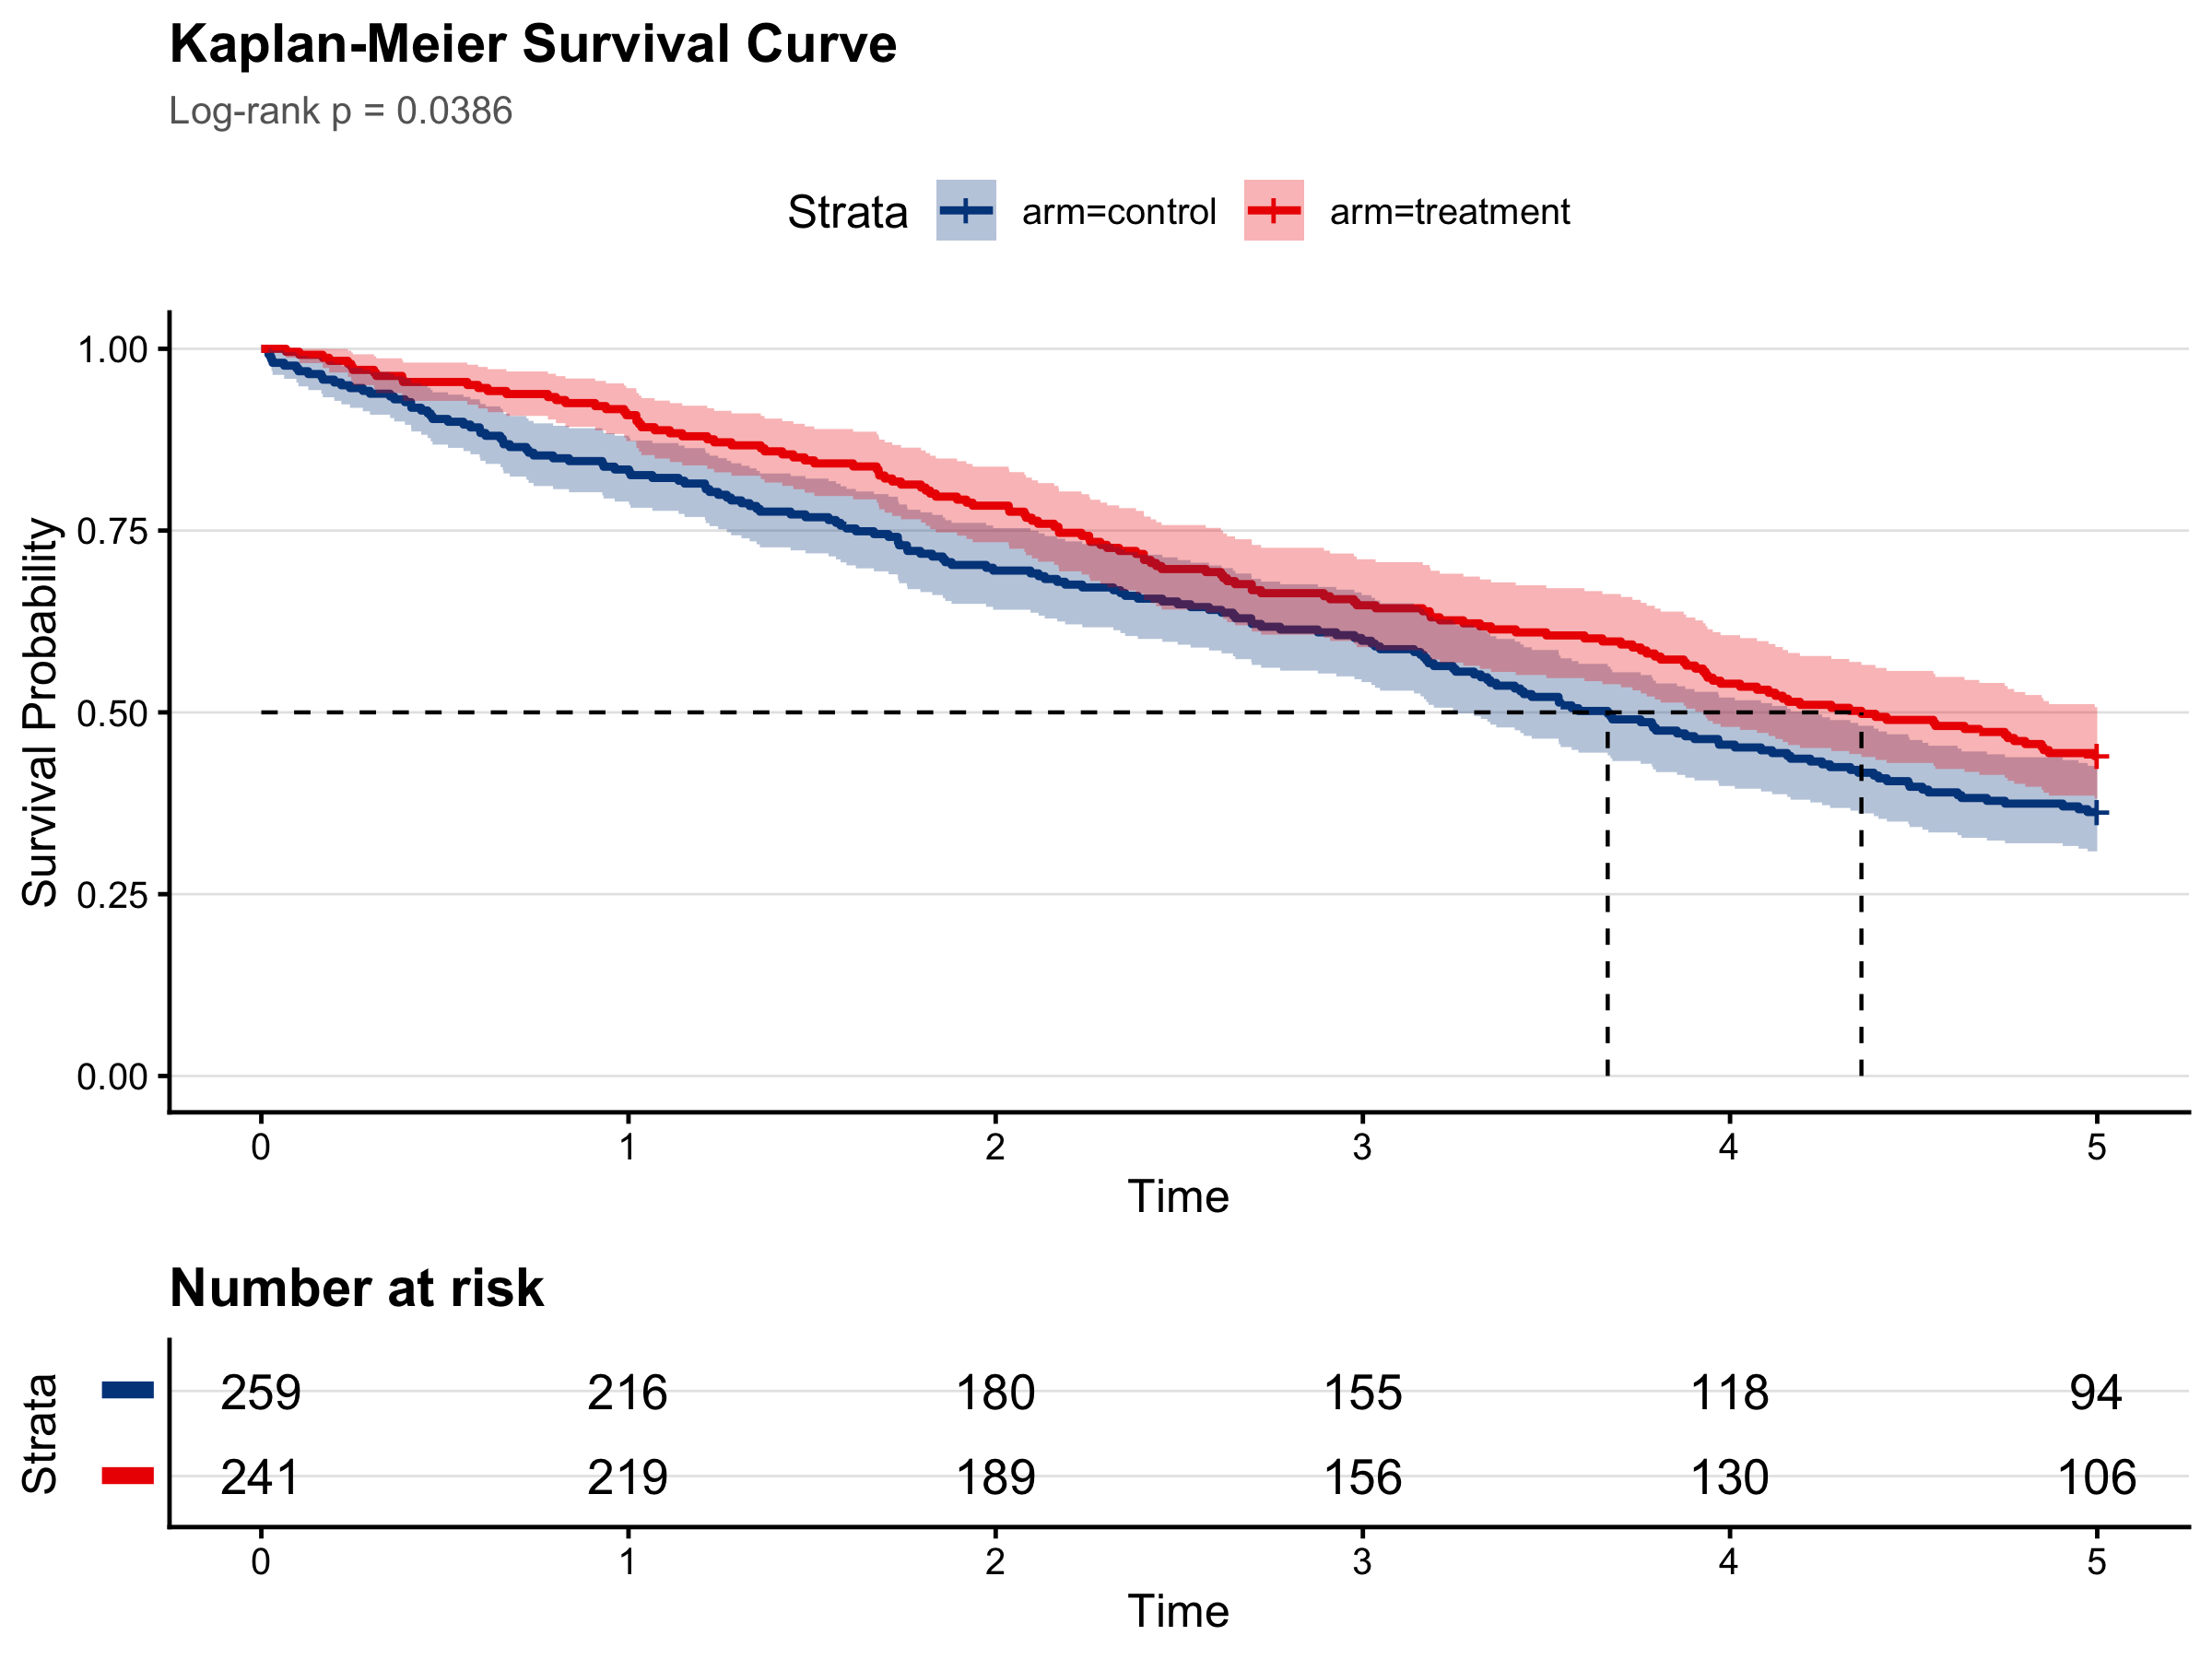
The first script generates KM curves using survminer::ggsurvplot:
library(survival)
library(survminer)

fit <- survfit(Surv(time, status) ~ group, data = df)

ggsurvplot(fit,
  pval = TRUE,
  risk.table = TRUE,
  palette = "lancet",
  xlab = "Time (months)",
  ylab = "Survival probability"
)The pipeline uses ggsci::scale_color_lancet() by default for journal-appropriate, colorblind-safe palettes.
4.4 Cox Proportional Hazards
cox_fit <- coxph(Surv(time, status) ~ group + age + stage, data = df)
summary(cox_fit)
Multivariable models are built stepwise, with covariates selected based on clinical relevance and the DAG, not p-value-based selection.
4.5 PH Assumption Checking
Script 04_ph_diagnostics.R tests the proportional hazards assumption using Schoenfeld residuals:
ph_test <- cox.zph(cox_fit)
print(ph_test)
plot(ph_test)If the global test is significant (p < 0.05), consider stratification, time-varying coefficients, or restricted mean survival time (RMST) as alternatives.
4.6 Running the Module
make analyze-standard PROJECT=my-studyThis executes all six scripts in order, writing results to projects/my-study/03_analysis/.
4.7 Demo: Standard Survival (Scenario 1)
N=500, 2-arm simulated RCT with HR approximately 0.70.
4.7.1 Kaplan-Meier Curves
4.7.2 Cox Proportional Hazards
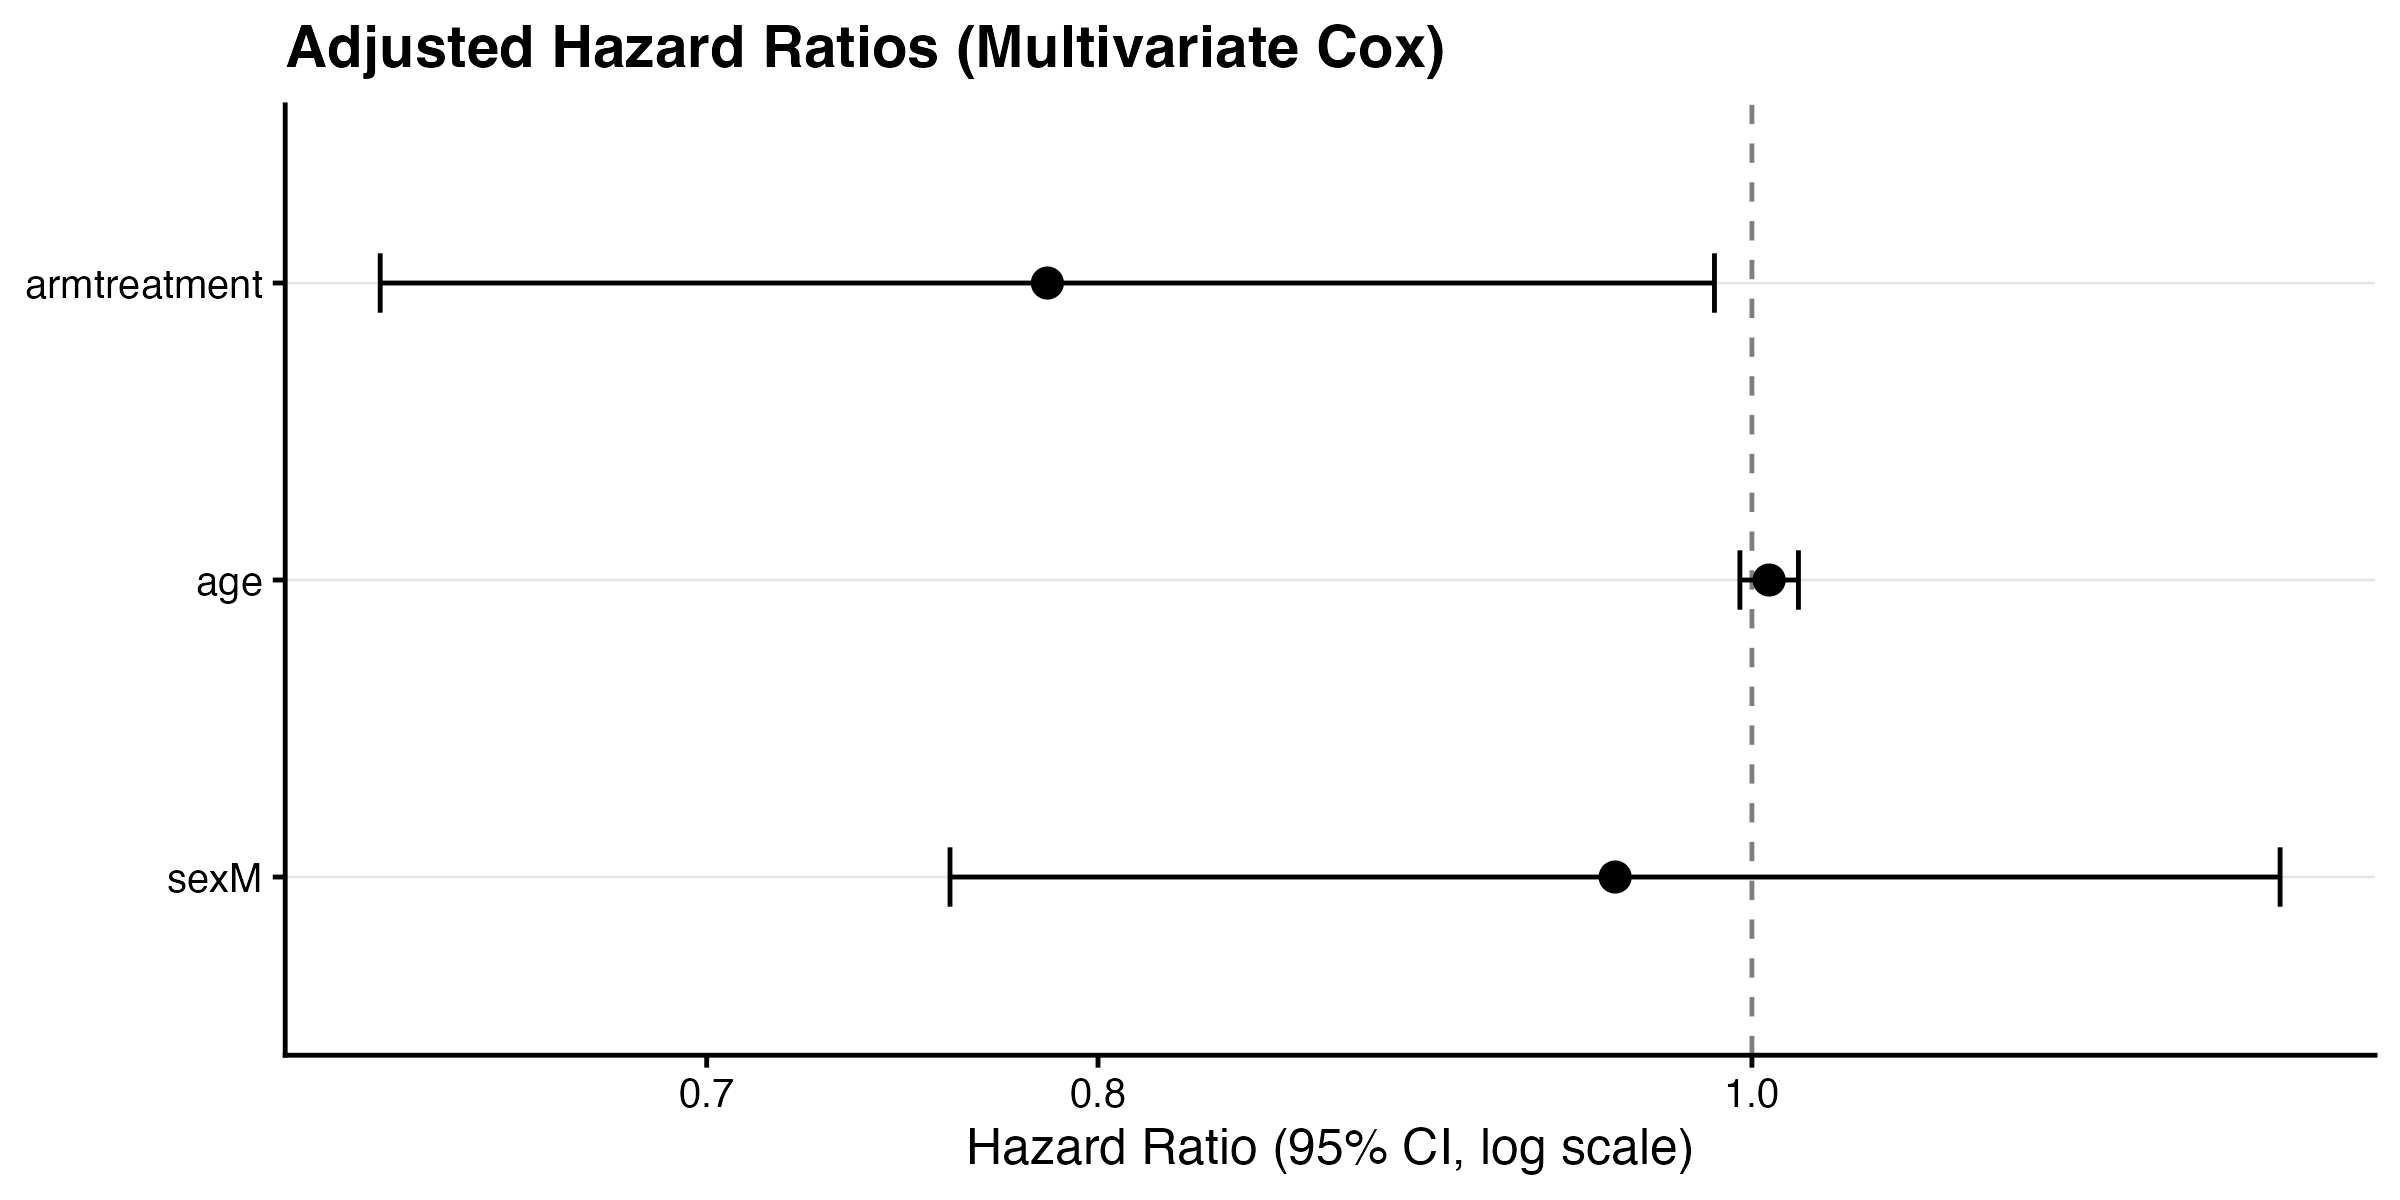
The multivariable Cox model found a significant treatment effect:
| Term | HR | 95% CI | p-value |
|---|---|---|---|
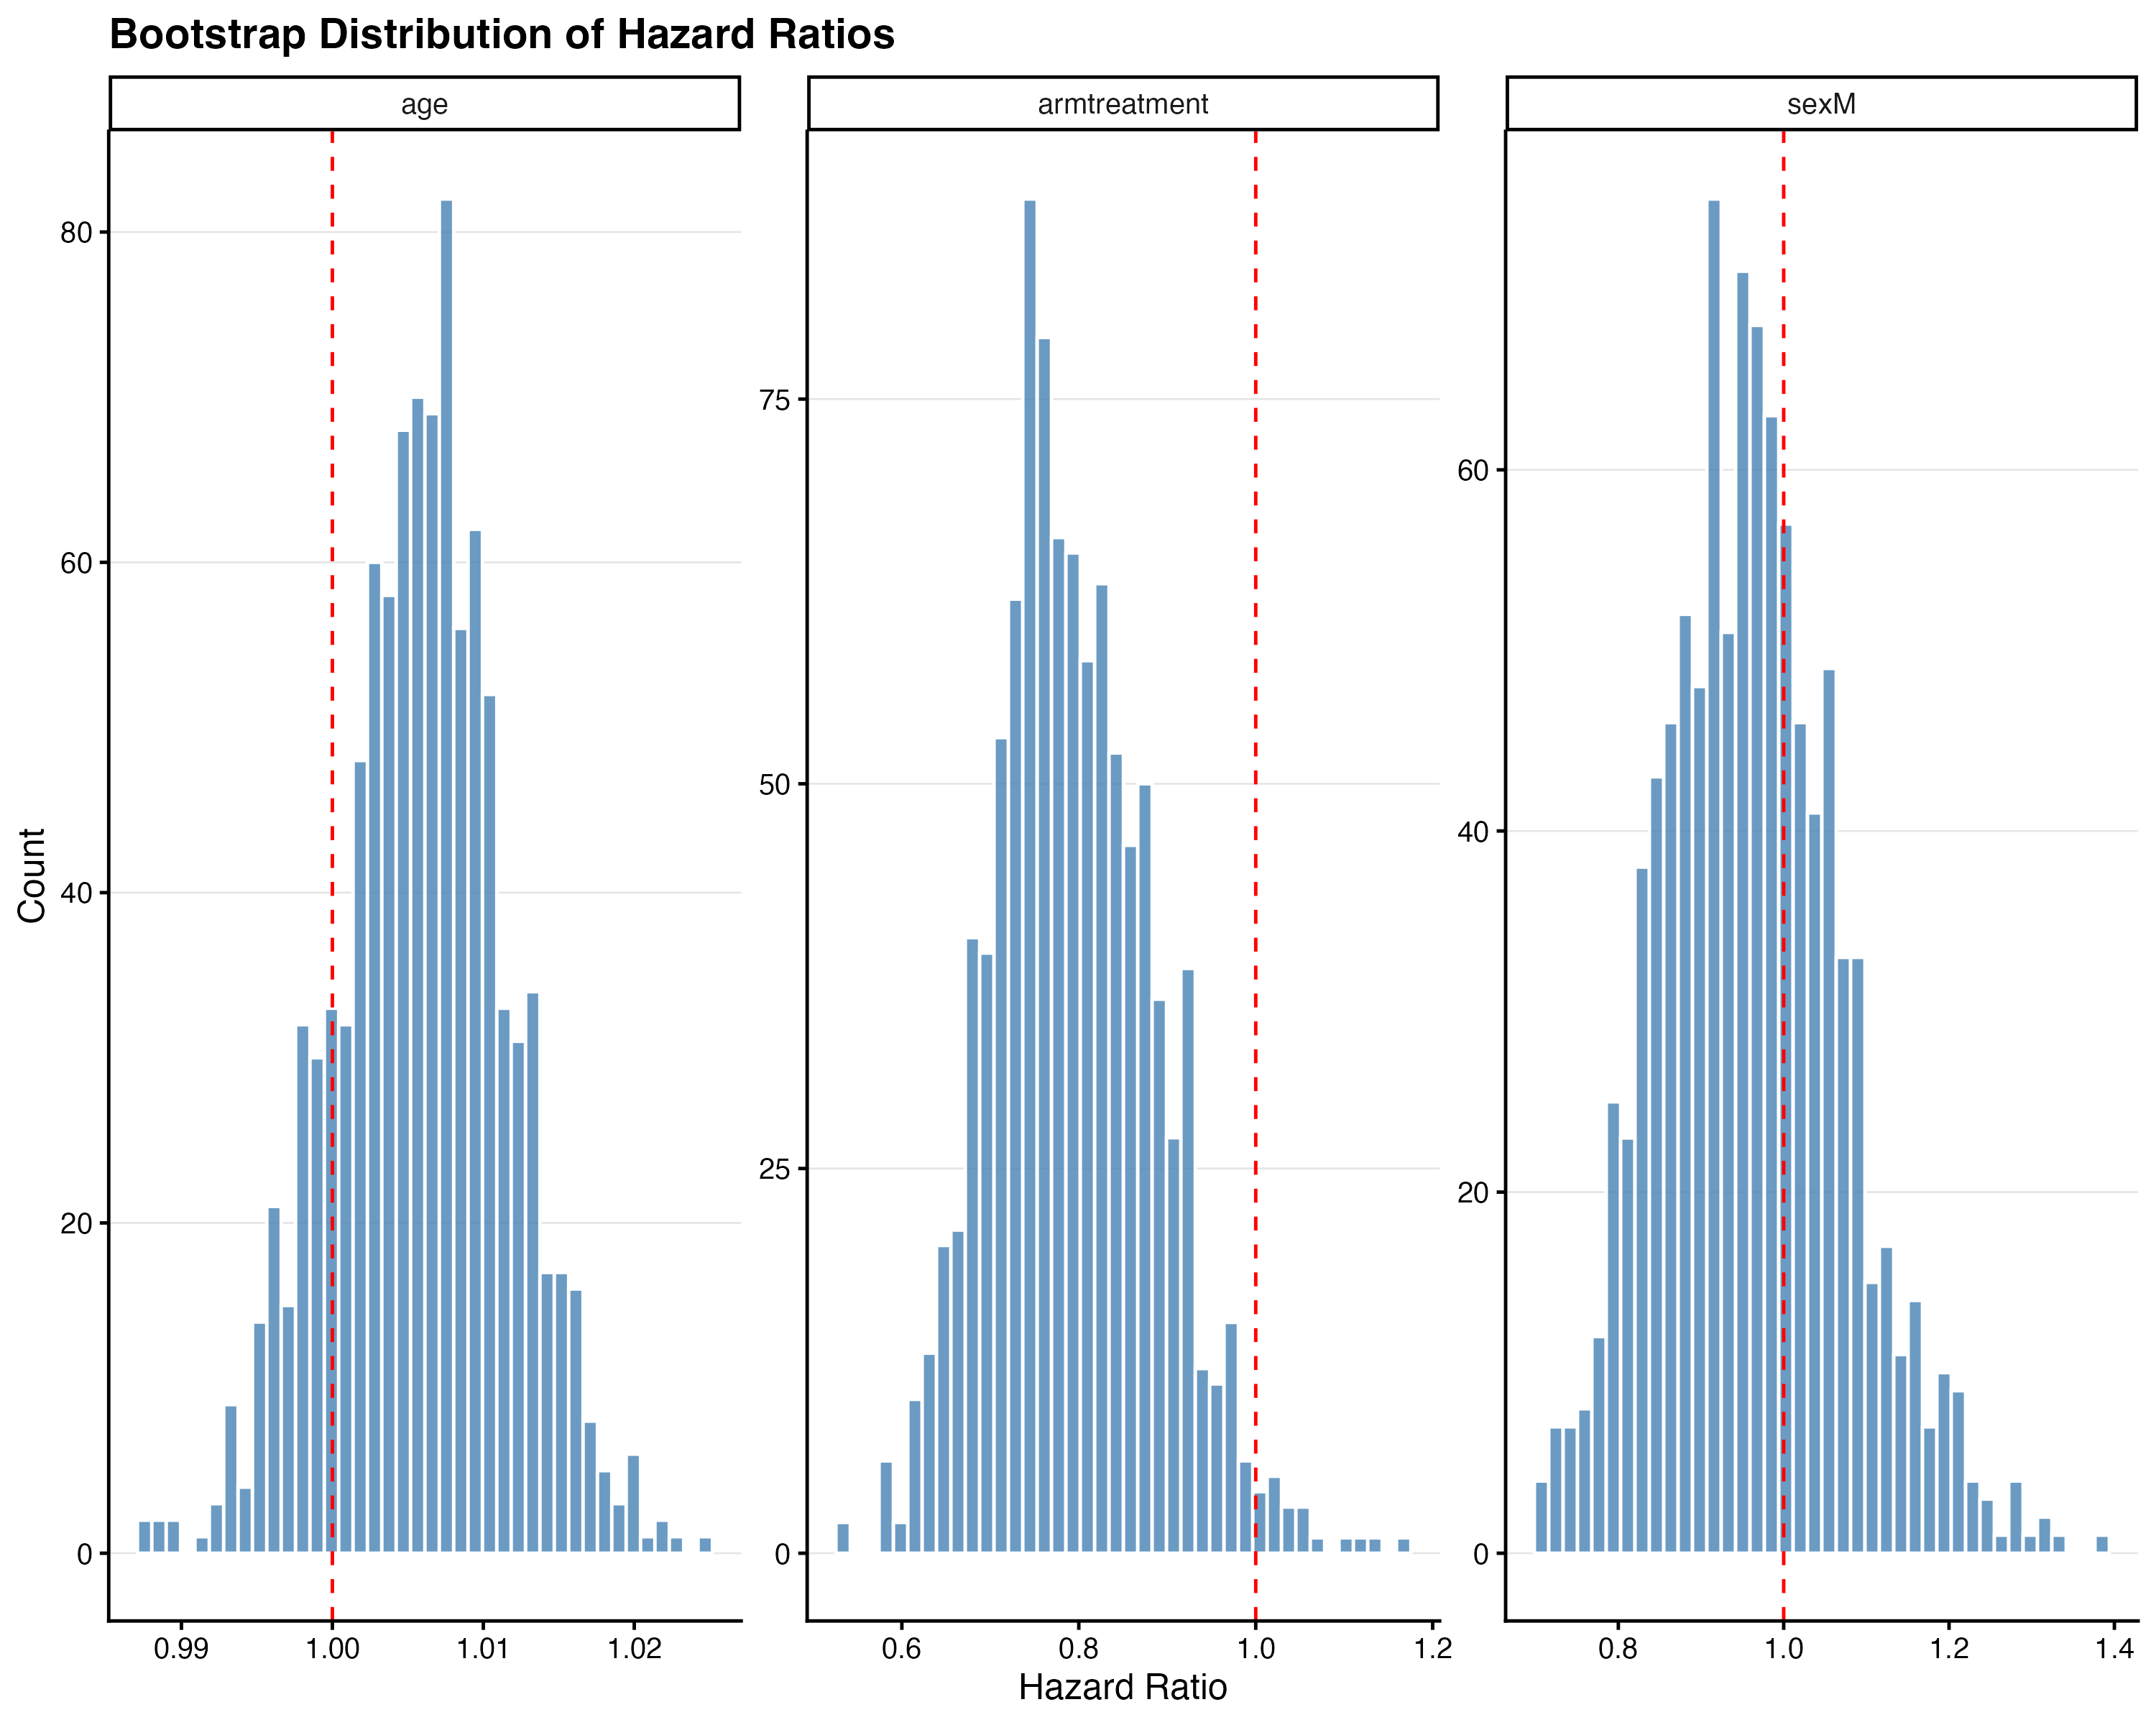
| Treatment (vs control) | 0.786 | 0.626–0.987 | 0.038 |
| Age (per year) | 1.006 | 0.996–1.016 | 0.248 |
| Sex (M vs F) | 0.954 | 0.761–1.198 | 0.687 |
Treatment reduced the hazard by approximately 21% (HR = 0.79, 95% CI: 0.63–0.99, p = 0.038).
4.7.3 PH Assumption Check
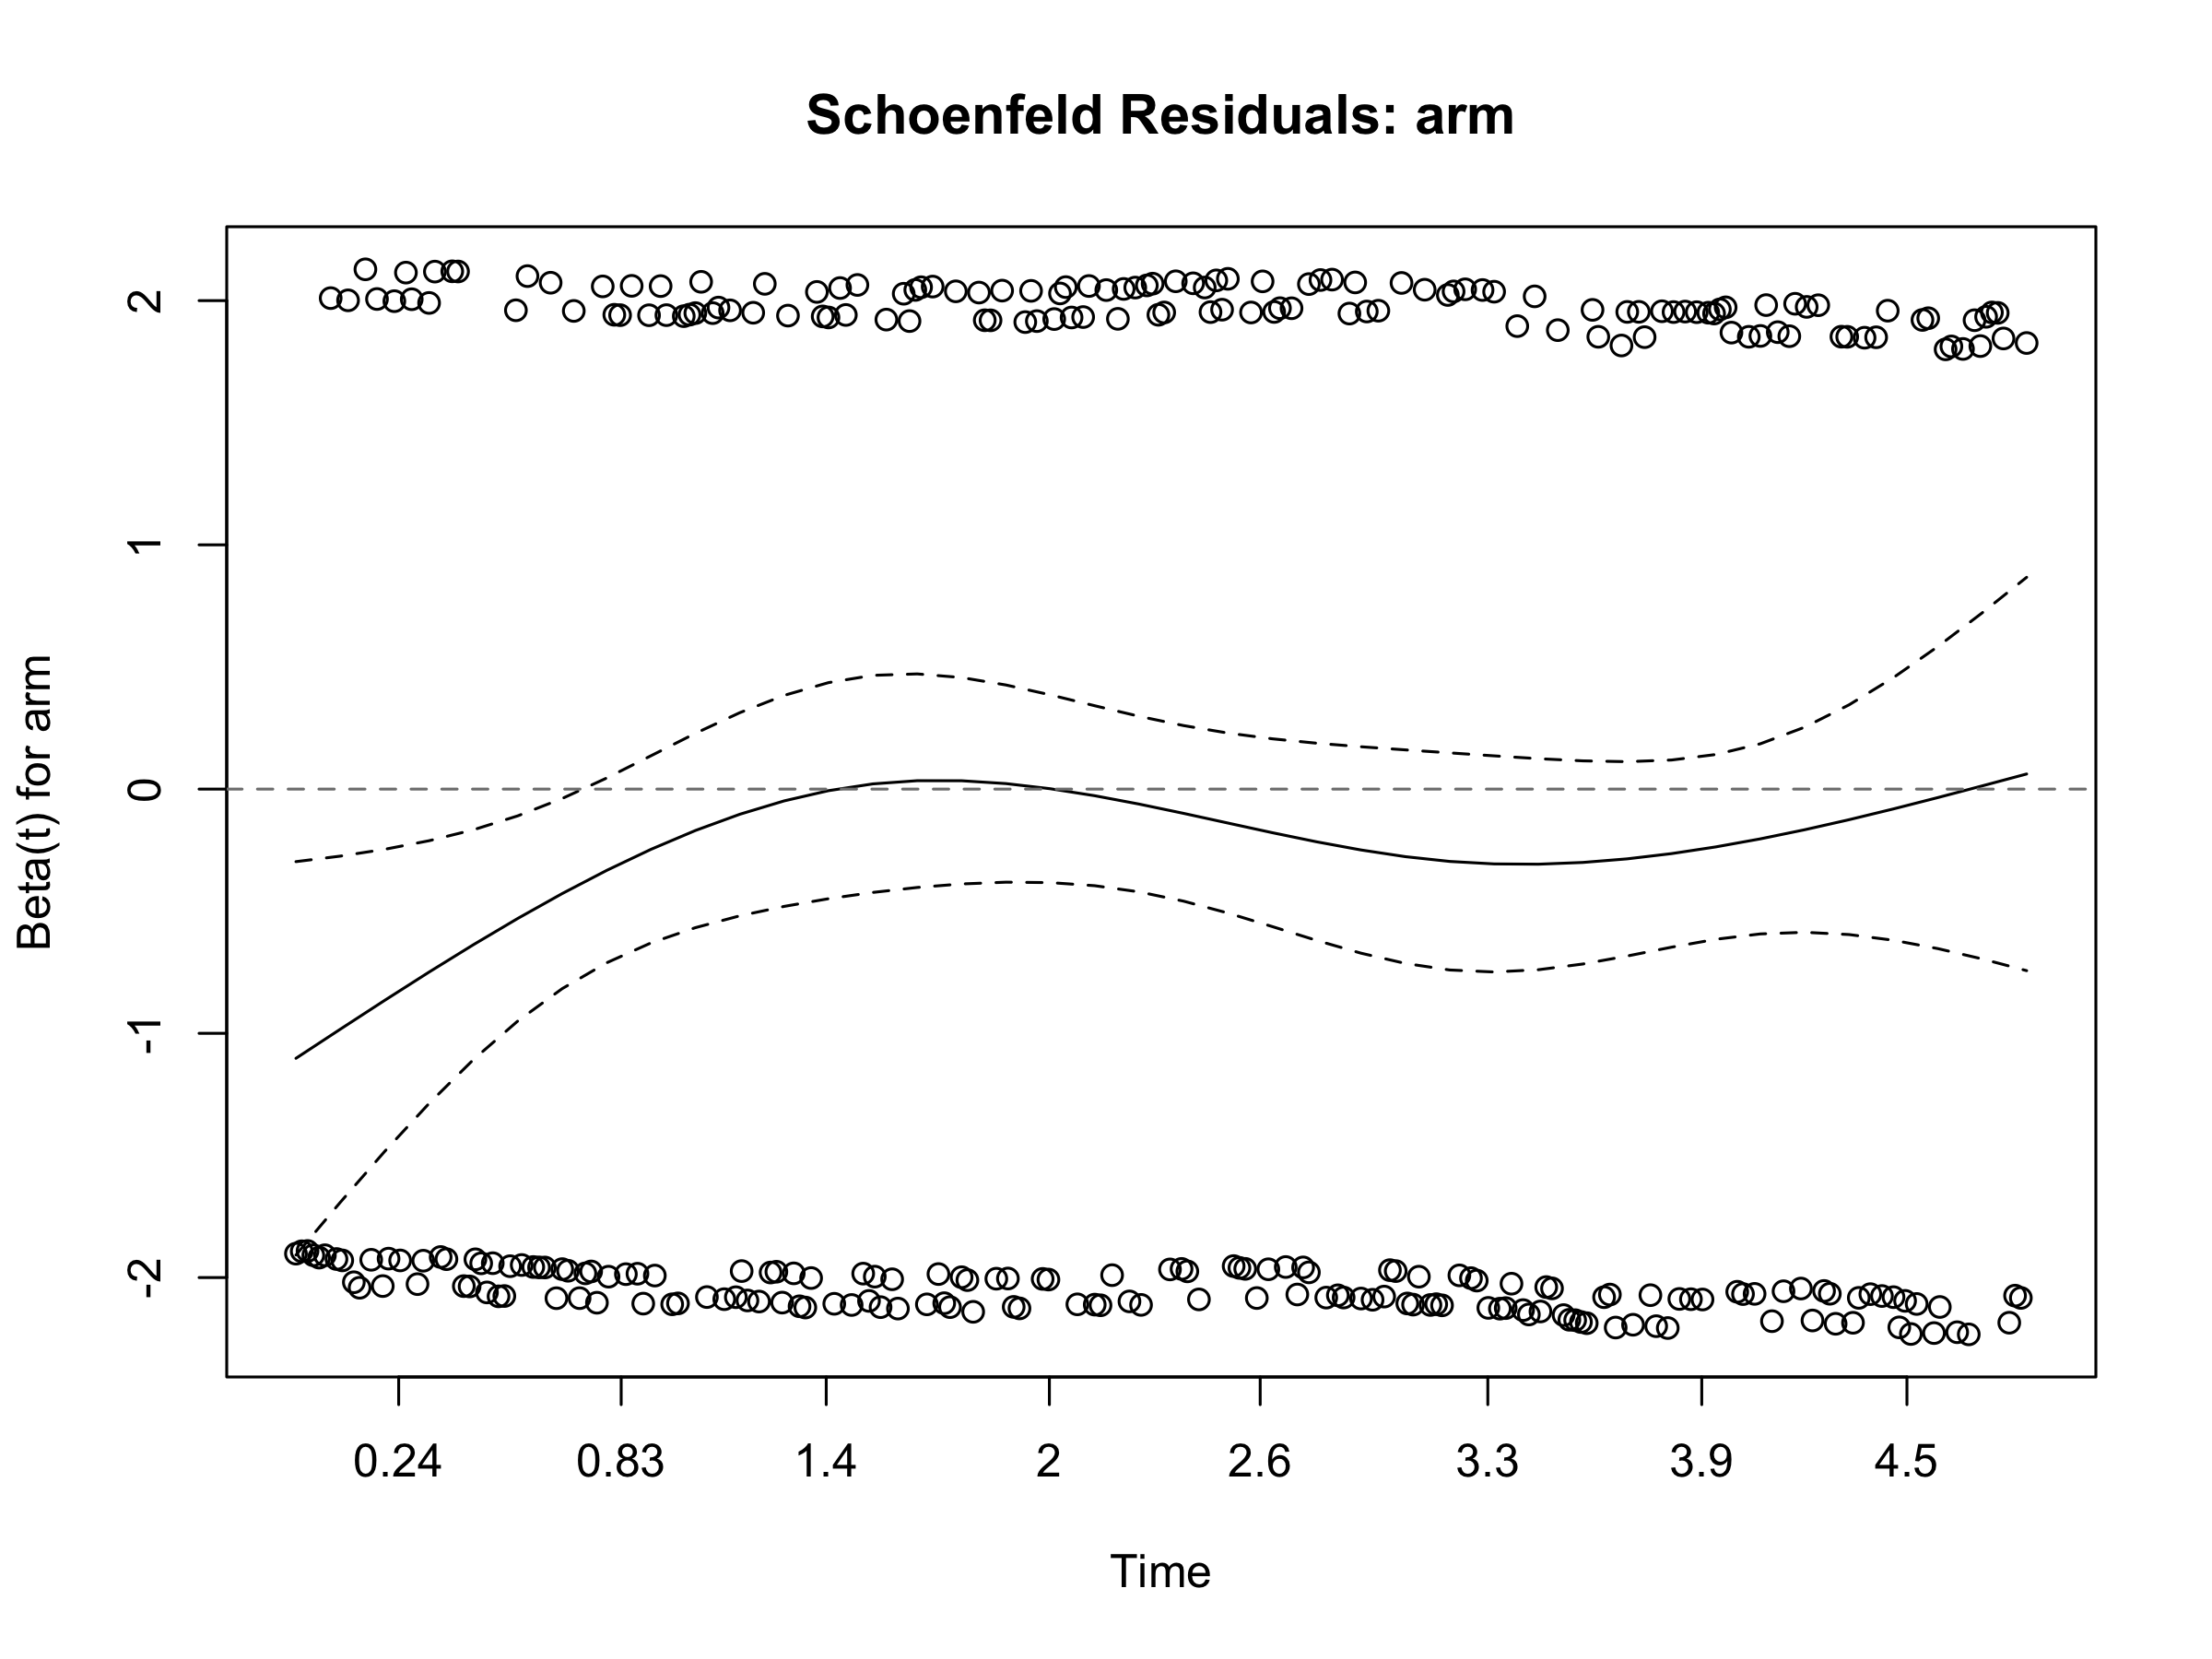
The Schoenfeld residual test confirmed the proportional hazards assumption holds for all covariates:
| Variable | Chi-sq | df | p-value |
|---|---|---|---|
| Arm | 1.367 | 1 | 0.242 |
| Age | 0.477 | 1 | 0.490 |
| Sex | 0.107 | 1 | 0.744 |
| GLOBAL | 1.896 | 3 | 0.594 |
The global test is non-significant (p = 0.594), confirming the PH assumption is reasonable for this dataset.
4.7.4 Sensitivity: Bootstrap