5 Competing Risks
When the diagnostic engine detects multiple event types, the pipeline routes to the competing risks module. This chapter explains when to use cumulative incidence functions (CIF) versus cause-specific versus subdistribution (Fine-Gray) models, and how the scripts implement each.
5.1 When Competing Risks Matter
If a patient can die from cancer or from cardiovascular disease, treating cardiovascular death as “censored” in a cancer-specific KM analysis overestimates the probability of cancer death. Competing risks methods handle this correctly.
5.2 Three Approaches Compared
| Approach | Estimates | Interpretation | Use When |
|---|---|---|---|
| Cumulative Incidence (CIF) | Probability of event k by time t | Accounts for all competing events | Descriptive / prognostic |
| Cause-specific Cox | Hazard of event k among those still at risk | Rate of occurrence | Aetiological questions |
| Fine-Gray | Subdistribution hazard | Effect on CIF directly | Prognostic / prediction models |
Use cause-specific hazards for understanding aetiology (what causes the event). Use Fine-Gray for prediction (what is the cumulative probability). Report both when possible1.
5.3 Script Pipeline
| Script | Purpose |
|---|---|
01_cif_estimation.R |
Non-parametric CIF with cmprsk::cuminc |
02_cause_specific_cox.R |
Cause-specific Cox for each event type |
03_fine_gray.R |
Fine-Gray subdistribution hazard model |
04_comparison_plot.R |
Side-by-side CIF and cause-specific curves |
05_sensitivity.R |
Sensitivity to event-type classification |
5.4 CIF Estimation
library(cmprsk)

cif <- cuminc(ftime = df$time, fstatus = df$event_type, group = df$group)
plot(cif, xlab = "Time (months)", ylab = "Cumulative incidence")
5.5 Fine-Gray Model
library(cmprsk)

fg <- crr(
  ftime = df$time,
  fstatus = df$event_type,
  cov1 = model.matrix(~ group + age + stage, data = df)[, -1],
  failcode = 1
)
summary(fg)
The subdistribution hazard ratio from Fine-Gray answers: “What is the effect of the covariate on the cumulative probability of the event, accounting for the fact that some patients will experience the competing event first?”
5.6 Running the Module
make analyze-competing PROJECT=my-studyAll five scripts execute sequentially, with results written to projects/my-study/03_analysis/.
5.7 Demo: Competing Risks (Scenario 2)
N=600, AML-like data with 3 event types (relapse, death in remission, death with disease).
5.7.1 Cumulative Incidence Functions
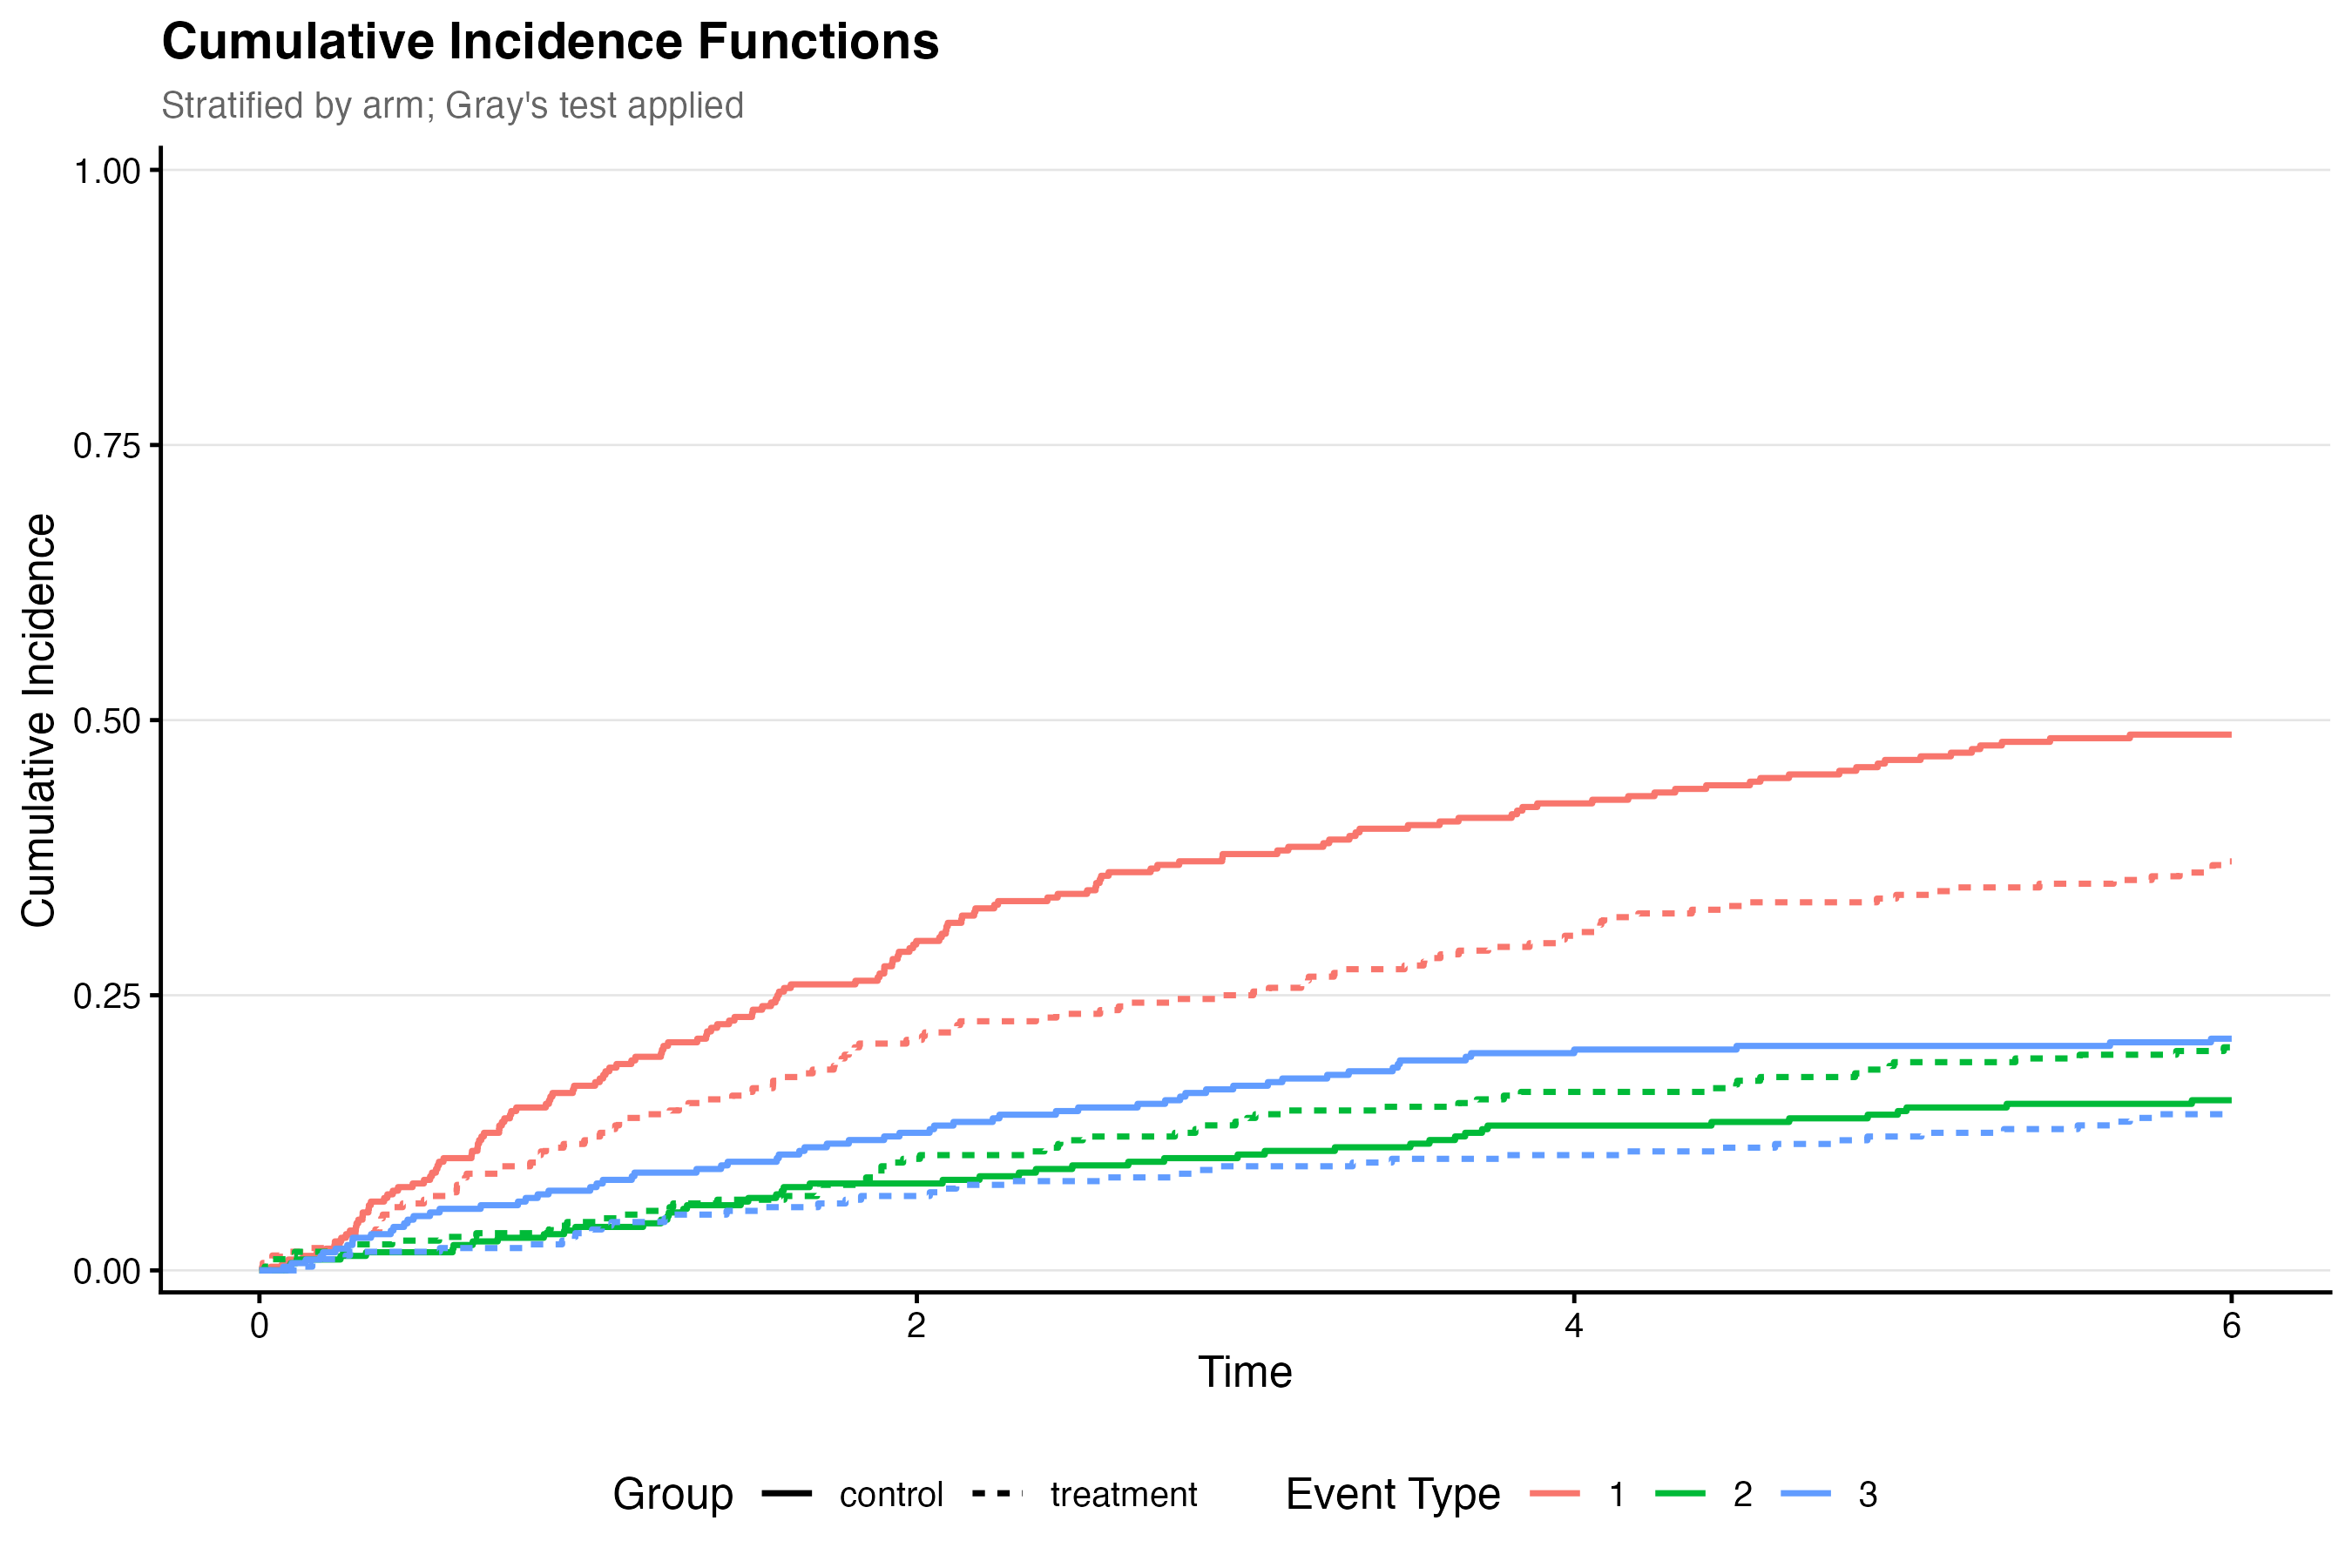
Gray’s test detected significant differences between treatment arms for two of the three event types:
| Event Type | Test Statistic | p-value |
|---|---|---|
| 1 (Relapse) | 8.815 | 0.003 |
| 2 (Death in remission) | 2.250 | 0.134 |
| 3 (Death with disease) | 5.277 | 0.022 |
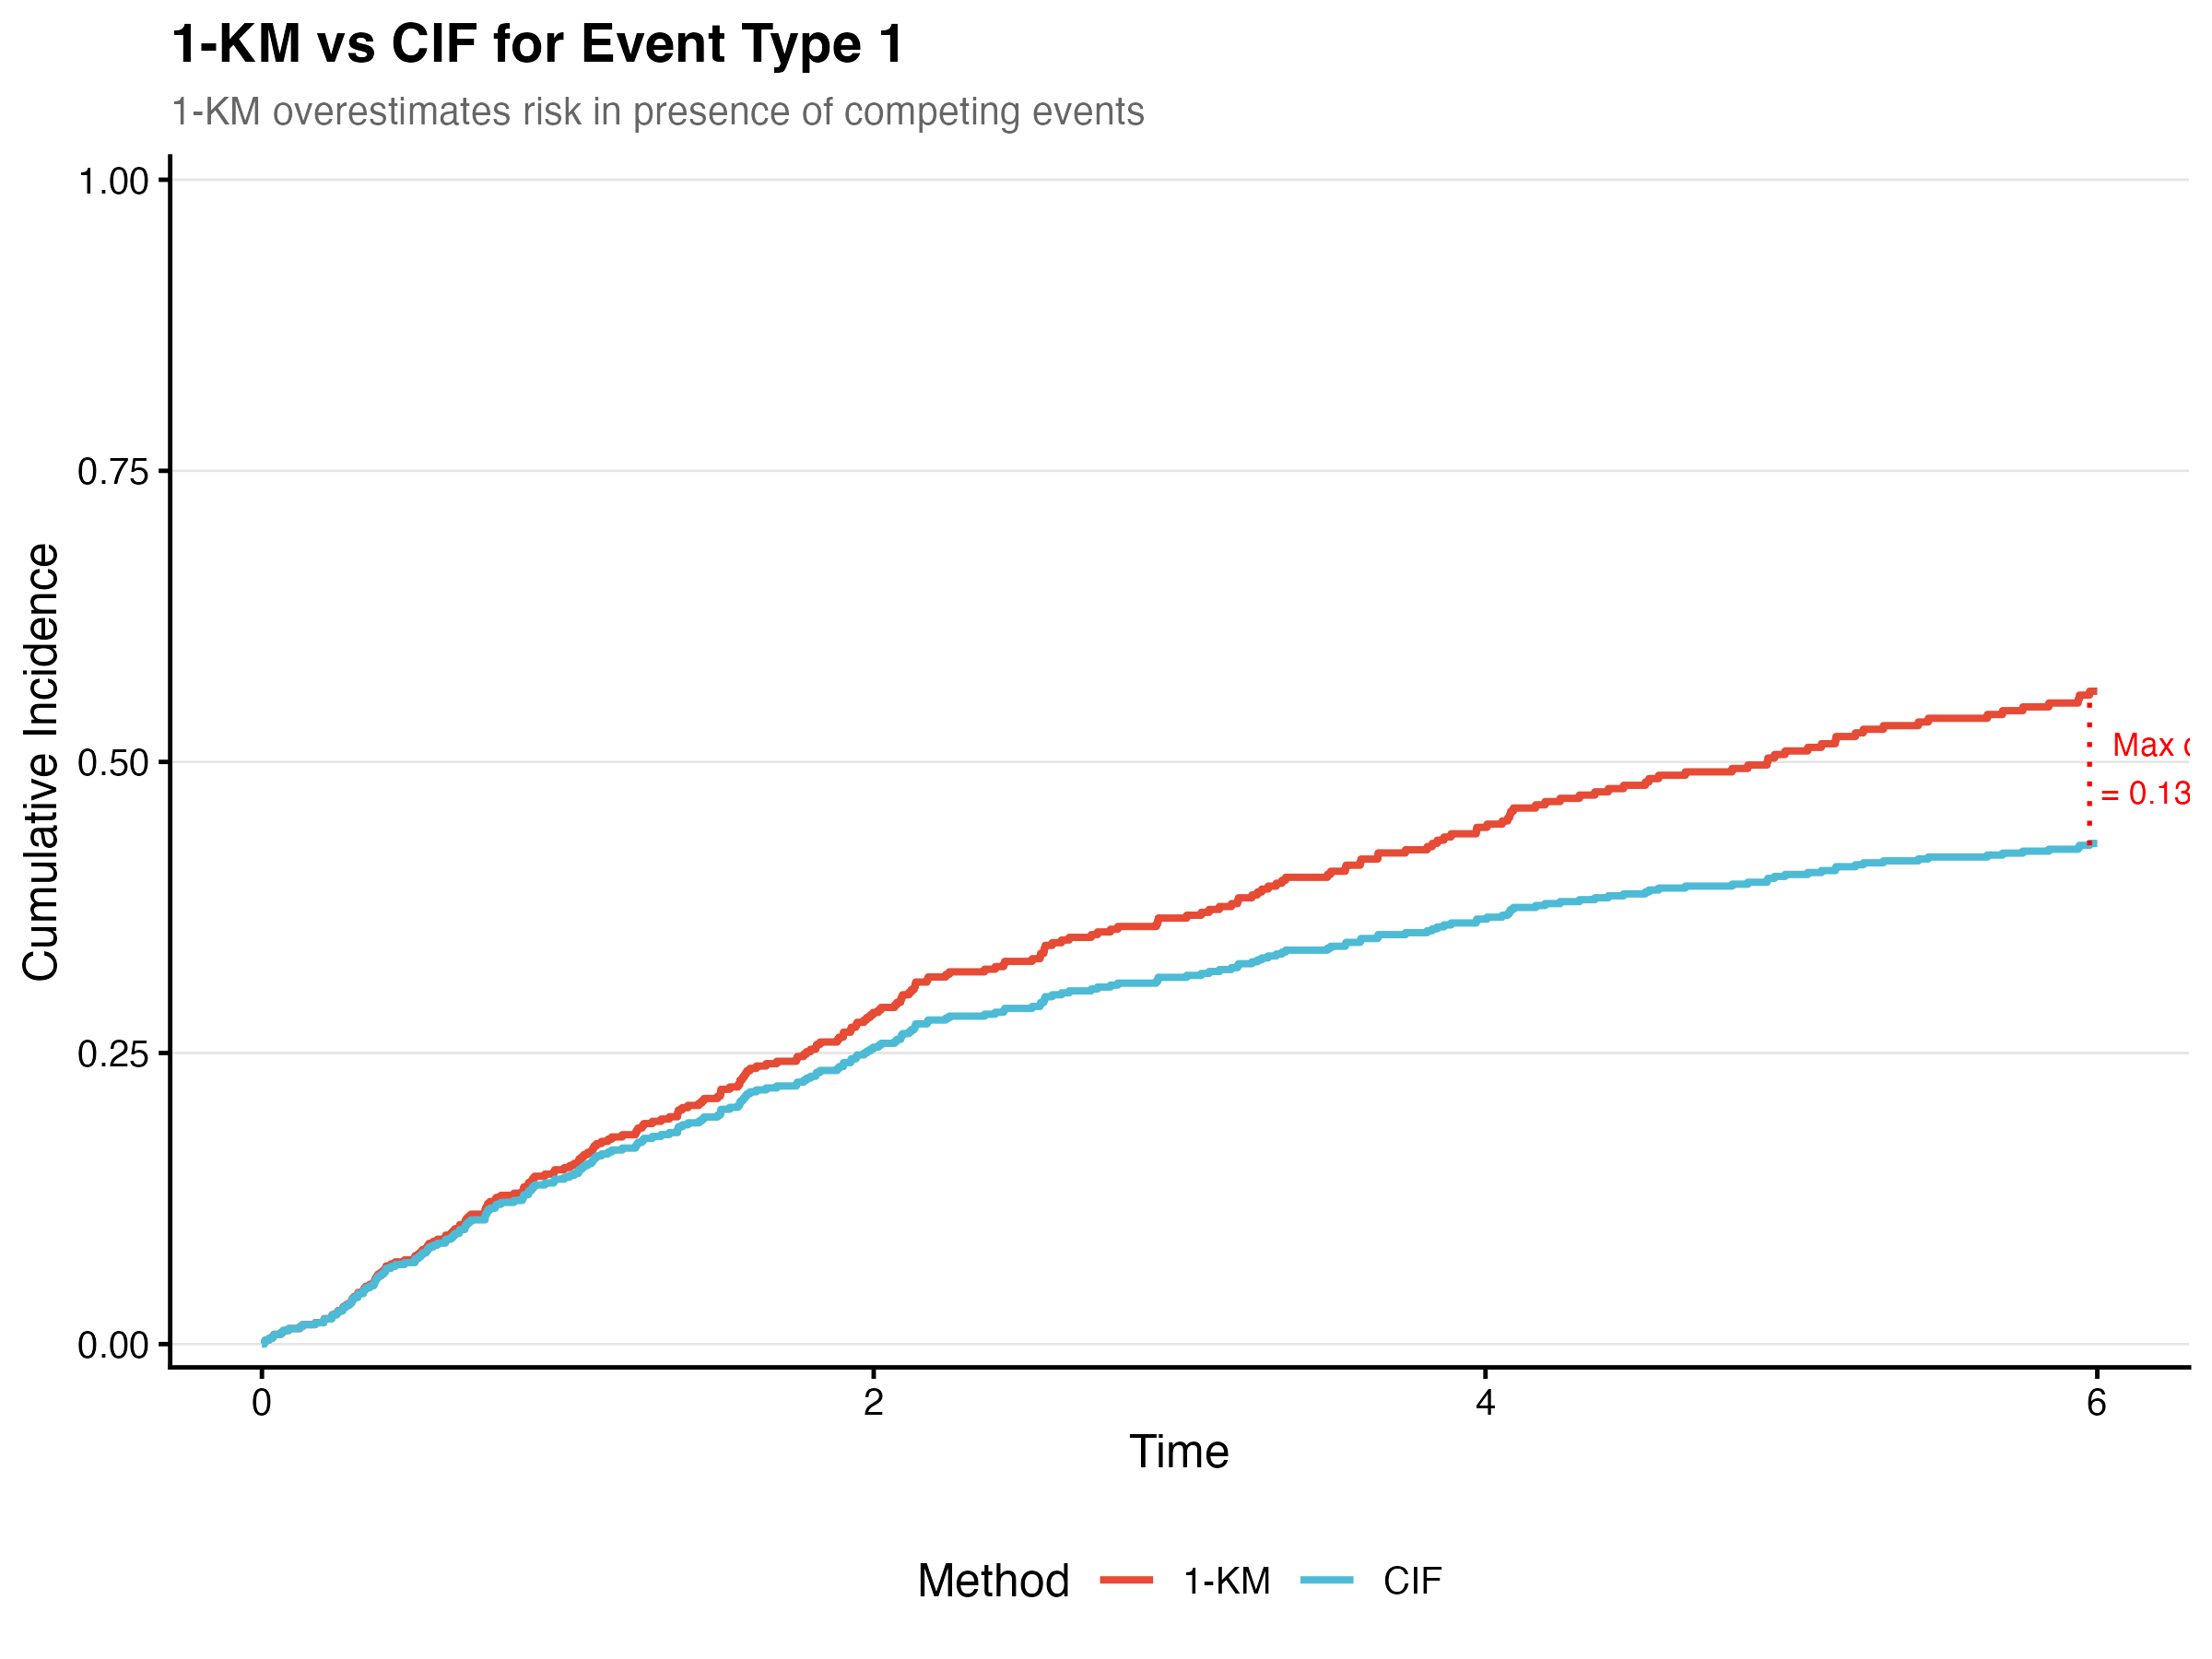
5.7.2 1-KM vs CIF Comparison
5.7.3 Cause-Specific vs Subdistribution HR
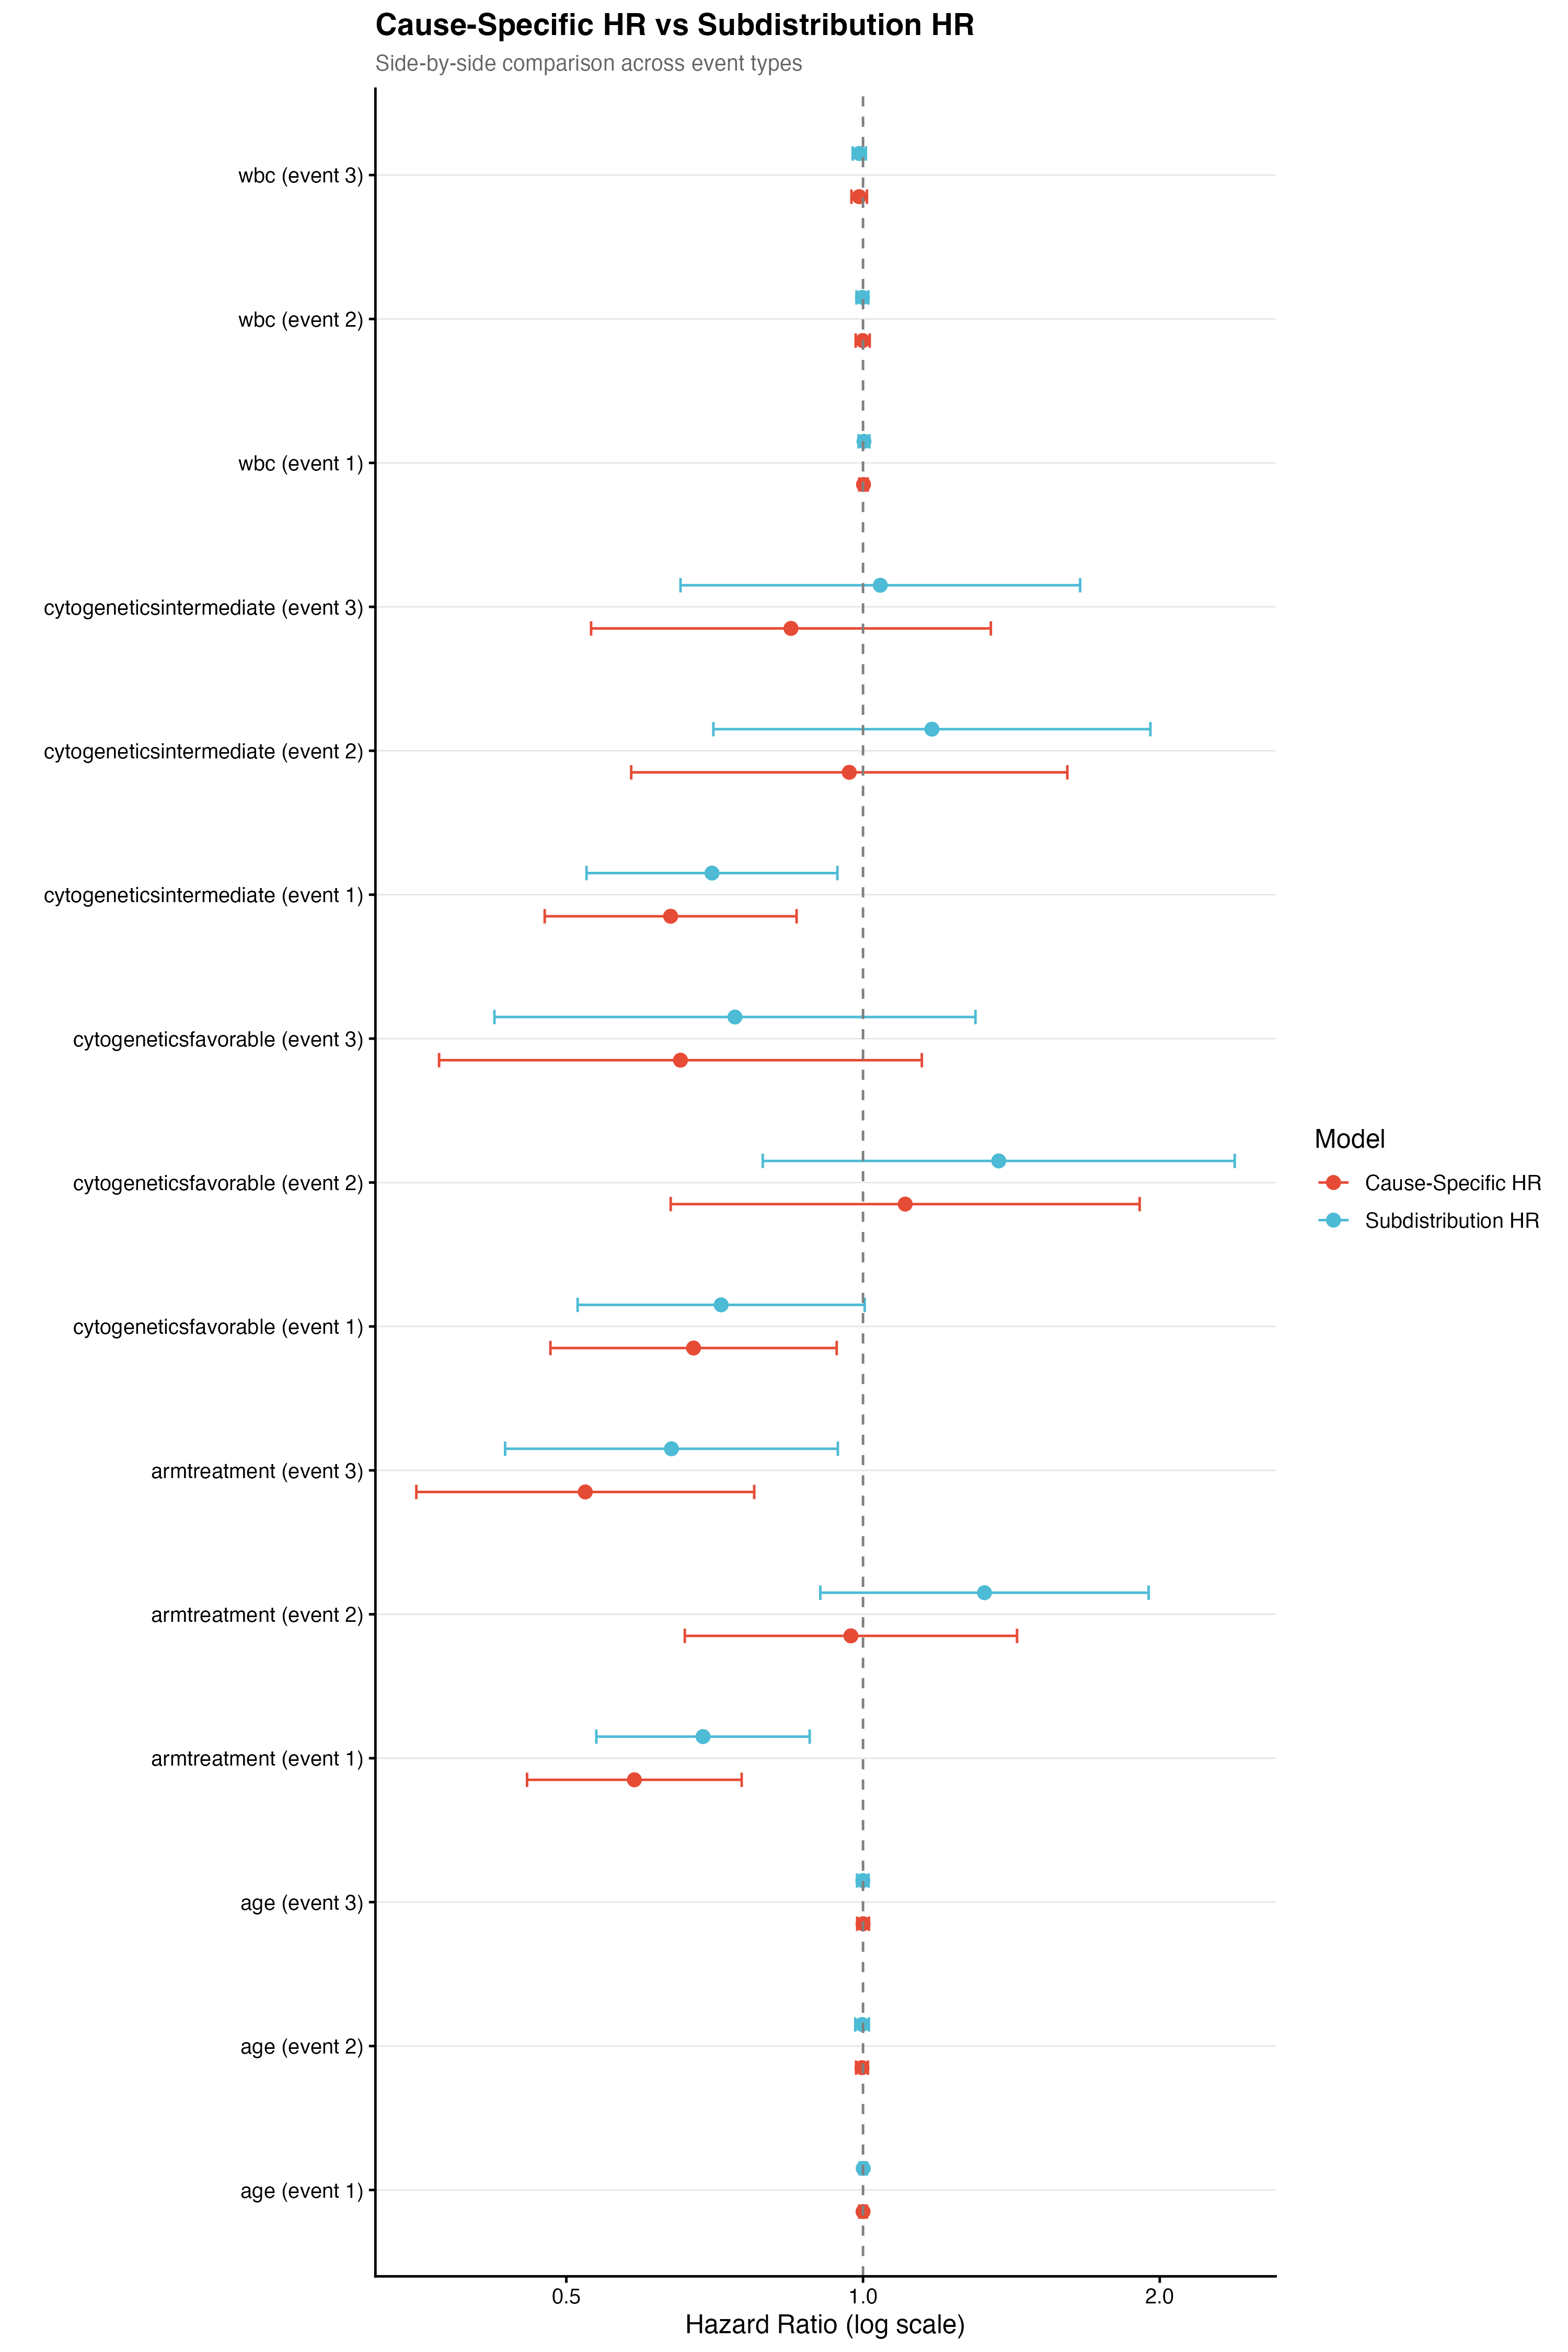
The two modelling approaches yield meaningfully different estimates, particularly for the treatment effect:
| Event Type | SHR (Fine-Gray) | 95% CI | csHR (Cause-Specific) | 95% CI |
|---|---|---|---|---|
| 1 (Relapse) | 0.688 | 0.536–0.883 | 0.586 | 0.456–0.753 |
| 2 (Death in remission) | 1.328 | 0.905–1.949 | 0.972 | 0.659–1.433 |
| 3 (Death with disease) | 0.639 | 0.433–0.943 | 0.523 | 0.352–0.776 |
For event type 2 (death in remission), the subdistribution HR (1.33) and cause-specific HR (0.97) diverge substantially — the Fine-Gray model suggests treatment increases the cumulative incidence of death in remission because it keeps patients alive longer (reducing the competing event of relapse), even though the cause-specific rate is unchanged.
The 1-KM estimator overestimates the event probability in the presence of competing risks. Always use CIF when competing events exist.