ICU MEDICATIONS
Drug |
Class |
Dose |
|
per kg |
average |
||
Pressors, Inotropes, and Chronotropes |
|||
Phenylephrine |
α1 |
10–300 μg/min |
|
Norepinephrine |
α1 >β1 |
1–40 μg/min |
|
Vasopressin |
V1 |
0.01–0.1 U/min (usually <0.04) |
|
Epinephrine |
α1, α2, β1, β2 |
2–20 μg/min |
|
Isoproterenol |
β1, β2 |
0.1–10 μg/min |
|
Dopamine |
D β, D α, β, D |
0.5–2 μg/kg/min 2–10 μg/kg/min >10 μg/kg/min |
50–200 μg/min 200–500 μg/min 500–1000 μg/min |
Dobutamine |
β1 >β2 |
2–20 μg/kg/min |
50–1000 μg/min |
Milrinone |
PDE |
± 50 μg/kg over 10 min then 0.25–0.75 μg/kg/min |
3–4 mg over 10 min then 20–50 μg/min |
Vasodilators |
|||
Nitroglycerin |
NO |
5–500 μg/min |
|
Nitroprusside |
NO |
0.25–10 μg/kg/min |
10–800 μg/min |
Labetalol |
α1, β1, and β2 blocker |
20–80 mg q10min or 10–120 mg/h |
|
Fenoldopam |
D |
0.1–1.6 μg/kg/min |
10–120 μg/min |
Clevidipine |
CCB |
1–32 mg/h |
|
Epoprostenol |
vasodilator |
2–20 ng/kg/min |
|
Antiarrhythmics |
|||
Amiodarone |
K et al. (Class III) |
150 mg over 10 min, then 1 mg/min × 6 h, then 0.5 mg/min × 18 h |
|
Lidocaine |
Na channel (Class IB) |
1–1.5 mg/kg then 1–4 mg/min |
100 mg then 1–4 mg/min |
Procainamide |
Na channel (Class IA) |
17 mg/kg over 60 min then 1–4 mg/min |
1 g over 60 min then 1–4 mg/min |
Ibutilide |
K channel (Class III) |
1 mg over 10 min, may repeat × 1 |
|
Propranolol |
β blocker |
0.5–1 mg q5min then 1–10 mg/h |
|
Esmolol |
β1 >β2 blocker |
500–1000 μg/kg then 50–200 μg/kg/min |
20–40 mg over 1 min then 2–20 mg/min |
Verapamil |
CCB |
2.5–5 mg over 1–2′, repeat 5–10 mg in 15–30′ prn 5–20 mg/h |
|
Diltiazem |
CCB |
0.25 mg/kg over 2 min reload 0.35 mg/kg × 1 prn then 5–15 mg/h |
20 mg over 2 min reload 25 mg × 1 prn then 5–15 mg/h |
Adenosine |
purinergic |
6 mg rapid push; if no response: 12 mg → 12–18 mg |
|
Sedation |
|||
Morphine |
opioid |
1–30 (in theory, unlimited) mg/h |
|
Fentanyl |
opioid |
50–100 μg then 50–800 (? unlimited) μg/h |
|
Propofol |
anesthetic |
1–3 mg/kg then 0.3–5 mg/kg/h |
50–200 mg then 20–400 mg/h |
Dexmedetomidine |
α2 agonist |
1 μg/kg over 10 min → 0.2–0.7 μg/kg/h |
|
Diazepam |
BDZ |
1–5 mg q1–2h then q6h prn |
|
Midazolam |
BDZ |
0.5–2 mg q5min prn; 0.02–0.1 mg/kg/h or 1–10 mg/h |
|
Lorazepam |
BDZ |
0.01–0.1 mg/kg/h |
|
Naloxone |
opioid antag. |
0.4–2 mg q2–3min to total of 10 mg |
|
Flumazenil |
BDZ antag. |
0.2 mg over 30 sec then 0.3 mg over 30 sec prn may repeat 0.5 mg over 30 sec to total of 3 mg |
|
Miscellaneous |
|||
Aminophylline |
PDE |
5.5 mg/kg over 20 min then 0.5–1 mg/kg/h |
250–500 mg then 10–80 mg/h |
Octreotide |
somatostatin analog |
50 μg then 50 μg/h |
|
Glucagon |
hormone |
3–10 mg IV slowly over 3–5 min then 3–5 mg/h |
|
Mannitol |
osmole |
1.5–2 g/kg over 30–60 min repeat q6–12h to keep osm 310–320 |
|

(Adapted from ACLS 2005 Guidelines)
ANTIBIOTICS
The following tables of spectra of activity for different antibiotics are generalizations.
Sensitivity data at your own institution should be used to guide therapy.
Penicillins |
||
Generation |
Properties |
Spectrum |
Natural (penicillin) |
Active vs. many GPC, GPR, anaerobes (not Bacteroides), some Gram ⊖ coccobacilli & Gram ⊖ diplococci |
Most streptococci, many enterococci, Listeria, C. acnes, Pasteurella, Actinomyces, syphilis |
Anti-staph (eg, nafcillin) |
Active vs. PCNase-producing Staph Little activity vs. Gram ⊖ |
Staphylococci (except MRSA) Streptococci |
Amino (eg, ampicillin) |
Penetrate porin channel of Gram ⊖ Not stable against PCNases |
PCN plus E. coli, Proteus, H. influenzae, Salmonella, Shigella |
Extended (eg, piperacillin) |
Penetrate porin channel of Gram ⊖ More resistant to PCNases |
Most GNR incl. Enterobacter, Pseudomonas, Serratia |
β-lact. inhib. (eg, sulbactam, clavulanate) with PCN derivative |
Inhibits some plasma-mediated β-lactamases |
Adds staph (not MRSA), most PCN-R anaerobes, & some GNR (H. flu, M. cat, some enterics); intrinsic activity against Acinetobacter |
Cephalosporins |
||
Resistant to most penicillin b-lactamases. No activity vs. enterococci. |
||
Generation |
Spectrum |
Indications |
1st (eg, cefazolin) |
Most GPC (incl. staph & strep, not MRSA); some GNR (incl. E. coli, Proteus, Klebsiella) |
Used for surgical Ppx & skin infxns |
2nd (eg, cefuroxime, cefotetan) |
↓ activity vs. GPC, ↑ vs. GNR. 2 subgroups: Resp: H. influenzae & M. catarrhalis GI/GU: ↑ activity vs. B. fragilis |
PNA/COPD flare Abdominal infxns |
3rd (eg, ceftriaxone, ceftazidime) |
Broad activity vs. GNR (not ESBL), streptococci, & some anaerobes. Ceftazidime active vs. Pseudomonas, less vs. strep |
PNA, sepsis, meningitis |
4th (eg, cefepime) |
↑ resistance to β-lactamases (incl. Enterobacter) |
Similar to 3rd gen. MonoRx for nonlocalizing febrile neutropenia |
5th (eg, ceftaroline) |
Only class of cephalosporin with MRSA activity. GN activity similar to ceftriaxone. NOT active vs. Pseudomonas. |
MRSA. Not 1st line for MRSA bacteremia. |
Combination (eg, ceftolozane-tazobactam, ceftazidime- avibactam) |
MDR GNRs, incl. Pseudomonas. Ceftaz-avi has activity vs. some carbapenemases. |
Complicated UTIs, complicated intra-abdominal infections. |
Other Beta-Lactams |
||
Class |
Properties |
Spectrum |
Carbapenems (eg, imipenem) |
Resistant to most β-lactamases |
Most Gram ⊕ & ⊖, incl. anaerobes; not MRSA or VRE |
Monobactams (aztreonam) |
Active vs. Gram ⊖ but not Gram ⊕ |
Gram ⊖ bacterial infxn in Pt w/ PCN or Ceph allergy |
Other Antibiotics |
|
Antibiotic |
Spectrum |
Vancomycin |
Gram ⊕ bacteria incl. MRSA, PCNase-producing pneumococci and enterococci (except VRE) |
Linezolid |
GPC incl. MRSA & VRE (check susceptibility for VRE) |
Daptomycin |
|
Quinolones |
GNR & atypicals. Levo and esp moxi ↑ activity vs. Gram ⊕. |
Aminoglycosides |
GNR. Synergy w/ cell-wall active abx (β-lactam, vanco) vs. GPC. ↓ activity in low pH (eg, abscess). No activity vs. anaerobes. |
Macrolides |
GPC, some respiratory Gram ⊖, atypicals |
TMP/SMX |
Most enteric GNR, Staph incl CA-MRSA, Stenotrophomonas, Nocardia, Toxo, Pneumocystis |
Clindamycin |
Most Gram ⊕ (except enterococci) & anaerobes (increasing resistance, especially GI) |
Metronidazole |
Almost all anaerobic Gram ⊖, most anaerobic Gram ⊕, some protozoa (Entamoeba, Trichomonas, et al.) |
Doxycycline |
Rickettsia, Ehrlichia, Anaplasma, Chlamydia, Mycoplasma, Nocardia, Lyme; many Staph and GNR |
Tigecycline |
Many GPC incl. MRSA & VRE; most GNR incl. ESBL but not Pseudomonas or Proteus; most anaerobes |
FORMULAE AND QUICK REFERENCE
CARDIOLOGY
Hemodynamic Parameters |
Normal Value |
Mean arterial pressure |
70–100 mmHg |
Heart rate (HR) |
60–100 bpm |
Right atrial pressure (RA) |
≤6 mmHg |
Right ventricular (RV) |
systolic 15–30 mmHg diastolic 1–8 mmHg |
Pulmonary artery (PA) |
systolic 15–30 mmHg mean 9–18 mmHg diastolic 6–12 mmHg |
Pulmonary capillary wedge pressure (PCWP) |
≤12 mmHg |
Cardiac output (CO) |
4–8 L/min |
Cardiac index |
2.6–4.2 L/min/m2 |
Stroke volume |
60–120 mL/contraction |
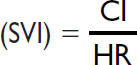
Stroke volume index |
40–50 mL/contraction/m2 |
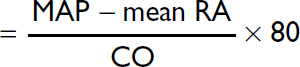
Systemic vascular resistance (SVR)
|
800–1200 dynes × sec/cm5 |
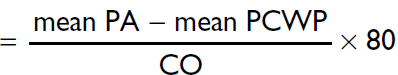
Pulmonary vascular resistance (PVR)
|
120–250 dynes × sec/cm5 |
“Rule of 6s” for PAC: RA ≤6, RV ≤30/6, PA ≤30/12, WP ≤12. Nb 1 mmHg = 1.36 cm water or blood.
Fick cardiac output
Oxygen consumption (L/min) = CO (L/min) × arteriovenous (AV) oxygen difference
CO = oxygen consumption/AV oxygen difference
Oxygen consumption must be measured (can estimate w/ 125 mL/min/m2, but inaccurate)
AV oxygen difference = Hb (g/dL) × 10 (dL/L) × 1.36 (mL O2/g of Hb) × (SaO2–SMVO2)
SaO2 is measured in any arterial sample (usually 93–98%)
SMVO2 (mixed venous O2) is measured in RA, RV, or PA (assuming no shunt) (nl ~75%)

Assessment of RV function (Circ 2017;136:314)
PAPi = Pulmonary artery pulsatility index = [PA systolic – PA diastolic] / RA pressure ≤0.9 predicts RV failure in acute MI; <1.85 predicts RV failure after LVAD
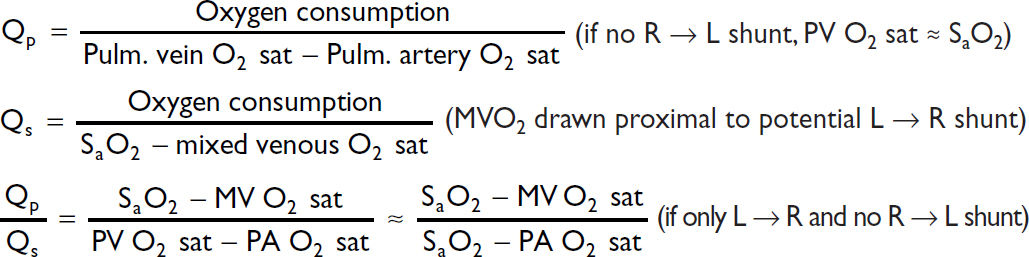
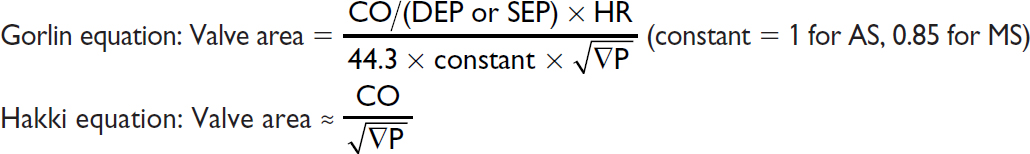
Shunts
Valve equations
Simplified Bernoulli: Pressure gradient (∇P) = 4 × v2 (where v = peak flow velocity)
Continuity (conservation of flow): Area1 × Velocity1 = A2 × V2 (where 1 & 2 different points)

Chest Imaging (CXR & CT) Patterns |
||
Pattern |
Pathophysiology |
Ddx |
Consolidation |
Radiopaque material in air space & interstitium patent airway → “air bronchograms” |
Acute: water (pulm. edema), pus (PNA), blood Chronic: neoplasm (BAC, lymphoma), aspiration, inflammatory (COP, eosinophilic PNA), PAP, granuloma (TB/fungal, alveolar sarcoid) |
Ground glass (CT easier than CXR) |
Interstitial thickening or partial filling of alveoli (but vessels visible) |
Acute: pulm. edema, infxn (PCP, viral, resolving bact. PNA) Chronic: ILD w/o fibrosis: acute hypersens., DIP/RB, PAP w/ fibrosis: IPF |
Septal lines Kerley A & B |
Radiopaque material in septae |
Cardiogenic pulm. edema, interstitial PNA viral, mycoplasma, lymphangitic tumor |
Reticular |
Lace-like net (ILD) |
ILD (esp. IPF, CVD, bleomycin, asbestos) |
Nodules |
Tumor Granulomas Abscess |
Cavitary: Primary or metastatic cancer, TB (react. or miliary), fungus, Wegener’s, RA septic emboli, PNA Noncavitary: any of above + sarcoid, hypersens. pneum., HIV, Kaposi’s sarcoma |
Wedge opac. |
Peripheral infarct |
PE, cocaine, angioinv. aspergillus, Wegener’s |
Tree-in-bud (best on CT) |
Inflammation of small airways |
Bronchopneumonia, endobronchial TB/MAI, viral PNA, aspiration, ABPA, CF, asthma, COP |
Hilar fullness |
↑ LN or pulm. arteries |
Neoplasm (lung, mets, lymphoma) Infxn (AIDS); Granuloma (sarcoid/TB/fungal) Pulmonary hypertension |
Upper lobe |
n/a |
TB, fungal, sarcoid, hypersens. pneum., CF, XRT |
Lower lobe |
n/a |
Aspiration, bronchiect., IPF, RA, SLE, asbestos |
Peripheral |
n/a |
COP, IPF & DIP, eos PNA, asbestosis |
CXR in heart failure
• ↑ cardiac silhouette (in systolic dysfxn, not in diastolic)
• Pulmonary venous hypertension: cephalization of vessels (vessels size >bronchi in upper lobes), peribronchial cuffing (fluid around bronchi seen on end → small circles), Kerley B lines (horizontal 1- to 2-cm lines at bases), ↑ vascular pedicle width, loss of sharp vascular margins, pleural effusions (~75% bilateral)
• Pulmonary edema: ranges from ground glass to consolidation; often dependent and central, sparing outer third (“bat wing” appearance)
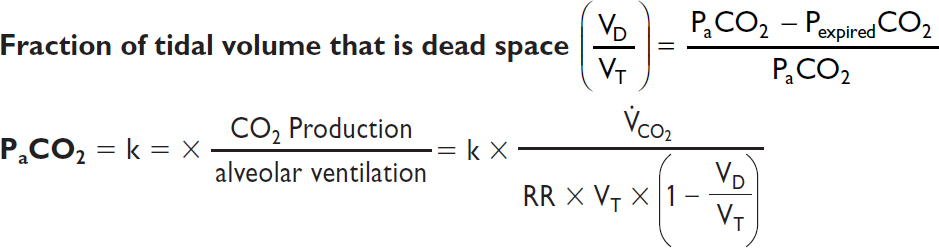
Dead space = lung units that are ventilated but not perfused
Intrapulmonary shunt = lung units that are perfused but not ventilated
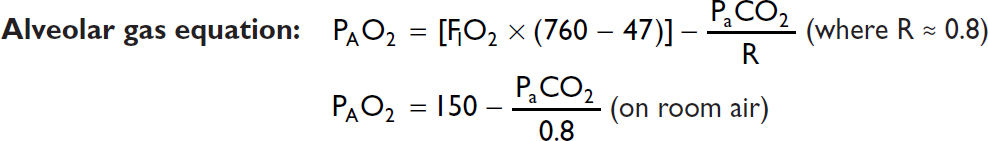
A-a gradient = PAO2 – PaO2 [normal A-a gradient ≈ 4 + (age/4)]
Minute ventilation (VE) = tidal volume (VT) × respiratory rate (RR) (nl 4–6 L/min)
Tidal volume (VT) = alveolar space (VA) + dead space (VD)
Modified Child-Turcotte-Pugh (CPS) Scoring System |
|||
|
Points Scored |
||
|
1 |
2 |
3 |
Ascites |
None |
Easily controlled |
Poorly controlled |
Encephalopathy |
None |
Grade 1 or 2 |
Grade 3 or 4 |
Bilirubin (mg/dL) |
<2 |
2–3 |
>3 |
Albumin (g/dL) |
>3.5 |
2.8–3.5 |
<2.8 |
PT (sec >control) or INR |
<4 <1.7 |
4–6 1.8–2.3 |
>6 >2.3 |
Classification |
|||
|
A |
B |
C |
Total points |
5–6 |
7–9 |
10–15 |
1-y survival |
100% |
80% |
45% |
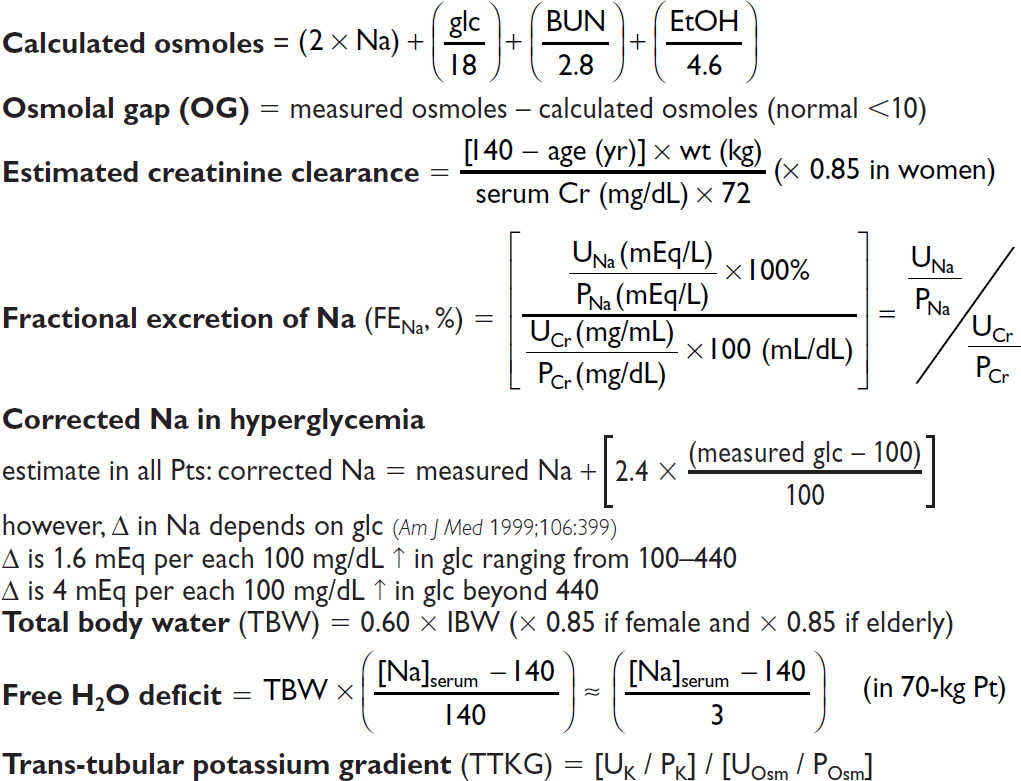
NEPHROLOGY
Anion gap (AG) = Na – (Cl + HCO3) (normal = [alb] × 2.5; typically 12 ± 2 mEq)
Delta-delta (ΔΔ) = [Δ AG (ie, calc. AG – expected) / Δ HCO3 (ie, 24 – measured HCO3)]
Urine anion gap (UAG) = (UNa + UK) – UCl
HEMATOLOGY
Peripheral Smear Findings (also see Photo Inserts) |
|
Feature |
Abnormalities and Diagnoses |
Size |
normocytic vs. microcytic vs. macrocytic → see below |
Shape |
Anisocytosis → unequal RBC size; poikilocytosis → irregular RBC shape acanthocytes = spur cells (irregular sharp projections) → liver disease Bite cells (removal of Heinz bodies by phagocytes) → G6PD deficiency echinocytes = burr cells (even, regular projections) → uremia, artifact Pencil cell → long, thin, hypochromic–very common in adv. iron deficiency Rouleaux → hyperglobulinemia (eg, multiple myeloma) Schistocytes, helmet cells → MAHA (eg, DIC, TTP/HUS), mechanical valve Spherocytes → HS, AIHA; sickle cells → sickle cell anemia Stomatocyte → central pallor appears as curved slit → liver disease, EtOH Target cells → liver disease, hemoglobinopathies, splenectomy Tear drop cells = dacryocytes → myelofibrosis, myelophthisic anemia, megaloblastic anemia, thalassemia |
Intra- RBC findings |
Basophilic stippling (ribosomes) → abnl Hb, sideroblastic, megaloblastic Heinz bodies (denatured Hb) → G6PD deficiency, thalassemia Howell-Jolly bodies (nuclear fragments) → splenectomy or functional asplenia (eg, advanced sickle cell) Nucleated RBCs → hemolysis, extramedullary hematopoiesis |
WBC findings |
Blasts → leukemia, lymphoma; Auer rods → acute myelogenous leukemia Hypersegmented (>5 lobes) PMNs: megaloblastic anemia (B12/folate def.) Pseudo-Pelger-Huët anomaly (bilobed nucleus, “pince-nez”) → MDS Toxic granules (coarse, dark blue) and Döhle bodies (blue patches of dilated endoplasmic reticulum) → (sepsis, severe inflammation) |
Platelet |
Clumping → artifact, repeat plt count # → periph blood plt count ~10,000 plt for every 1 plt seen at hpf (100×) Size → MPV (mean platelet volume) enlarged in ITP |
(NEJM 2005;353:498)
Heparin for Thromboembolism |
|
80 U/kg bolus 18 U/kg/h |
|
PTT |
Adjustment |
<40 |
bolus 5000 U, ↑ rate 300 U/h |
40–49 |
bolus 3000 U, ↑ rate 200 U/h |
50–59 |
↑ rate 150 U/h |
60–85 |
no Δ |
86–95 |
↓ rate 100 U/h |
96–120 |
hold 30 min, ↓ rate 100 U/h |
>120 |
hold 60 min, ↓ rate 150 U/h |
(Modified from Chest 2008;133:141S)
Heparin for ACS |
|
60 U/kg bolus (max 4000 U) 12 U/kg/h (max 1000 U/h) |
|
PTT |
Adjustment |
<40 |
bolus 3000 U, ↑ rate 100 U/h |
40–49 |
↑ rate 100 U/h |
50–75 |
no Δ |
76–85 |
↓ rate 100 U/h |
86–100 |
hold 30 min, ↓ rate 100 U/h |
>100 |
hold 60 min, ↓ rate 200 U/h |
(Modified from Circ 2007;116:e148 & Chest 2008;133:670)
✓ PTT q6h after every Δ (t. of heparin ~90 min) and then qd or bid once PTT is therapeutic
✓ CBC qd (to ensure Hct and plt counts are stable)
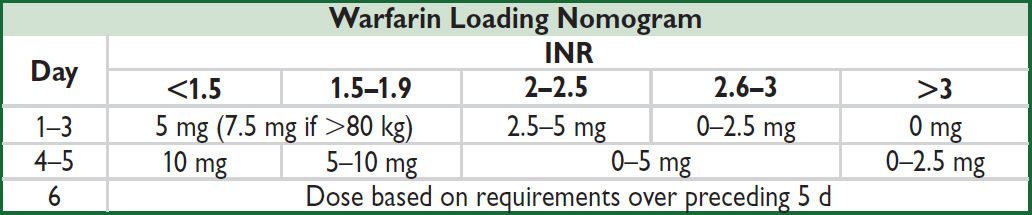
(Annals 1997;126:133; Archives 1999;159:46) or, go to www.warfarindosing.org
Warfarin-heparin overlap therapy
• Indications: when failure to anticoagulate carries ↑ risk of morbidity or mortality (eg, DVT/PE, intracardiac thrombus)
• Rationale: (1) Half-life of factor VII (3–6 h) is shorter than half-life of factor II (60–72 h);
∴ warfarin can elevate PT before achieving a true antithrombotic state
(2) Protein C also has half-life less than that of factor II;
∴ theoretical concern of hypercoagulable state before antithrombotic state
• Method: (1) Therapeutic PTT is achieved using heparin
(2) Warfarin therapy is initiated
(3) Heparin continued until INR therapeutic for ≥2 d and ≥4–5 d of warfarin (roughly corresponds to ~2 half-lives of factor II or a reduction to ~25%)
Common Warfarin-Drug Interactions |
|
Drugs that ↑ PT |
Drugs that ↓ PT |
Amiodarone Antimicrobials: erythromycin, ? clarithro, ciprofloxacin, MNZ, sulfonamides Antifungals: azoles Acetaminophen, cimetidine, levothyroxine |
Antimicrobials: rifampin CNS: barbiturates, carbamazepine, phenytoin (initial transient ↑ PT) Cholestyramine |
ENDOCRINOLOGY
Examples of Various Cosyntropin Stimulation Test Results |
|||
0′ |
30′ |
60′ |
Interpretation |
5.3 |
15.5 |
23.2 |
Normal stimulation test |
1.5 |
13.3 |
21.1 |
Acute central AI (eg, apoplexy or CNS bleed). Can look normal. |
1.2 |
1.5 |
2.0 |
1° AI (eg, Addisons or adrenal bleed). Flat or minimal stim. |
0.8 |
10.0 |
19.7 |
Acute effect of glucocorticoids: low initial value but stims >threshold |
5.3 |
7.2 |
8.9 |
Chronic 2° AI: some cortisol production and stim, but evidence of adrenal atrophy |
6.7 |
19.5 |
17.2 |
“Early peak” (fast metab): ~5% of Pts peak at 30’ rather than 60’ |
6.3 |
11.5 |
16.2 |
Equivocal test. Can occur due to mild AI, acute illness, liver disease, low cortisol binding protein, renal disease, etc. |
OTHER
NOTES
Table of contents
- Cover
- Title Page
- Copyright Page
- Contents
- Contributing Authors
- Foreword
- Preface
-
CARDIOLOGY
- Electrocardiography
- Chest Pain
- Noninvasive Evaluation of CAD
- Coronary Angiography & PCI
- Stable Ischemic Heart Disease
- Acute Coronary Syndromes
- PA Catheter and Tailored Therapy
- Heart Failure
- Cardiomyopathies
- Valvular Heart Disease
- Pericardial Disease
- Hypertension
- Aortic Aneurysms
- Acute Aortic Syndromes
- Arrhythmias
- Atrial Fibrillation
- Syncope
- Cardiac Rhythm Management Devices
- Cardiac Risk Assessment for Noncardiac Surgery
- Peripheral Artery Disease
-
PULMONARY
- Dyspnea
- Pulmonary Function Tests
- Asthma
- Anaphylaxis
- Chronic Obstructive Pulmonary Disease
- Solitary Pulmonary Nodule
- Hemoptysis
- Bronchiectasis
- Cystic Fibrosis
- Interstitial Lung Disease
- Pleural Effusion
- Venous Thromboembolism
- Pulmonary Hypertension
- Respiratory Failure
- Mechanical Ventilation
- Acute Respiratory Distress Syndrome
- Sepsis and Shock
- Toxicology
- Lung Transplant
- GASTROENTEROLOGY
- NEPHROLOGY
-
HEMATOLOGY-ONCOLOGY
- Anemia
- Disorders of Hemostasis
- Platelet Disorders
- Coagulopathies
- Hypercoagulable States
- Disorders of Leukocytes
- Transfusion Therapy
- Myelodysplastic Syndromes
- Myeloproliferative Neoplasms
- Leukemia
- Lymphoma and CLL
- Plasma Cell Dyscrasias
- Hematopoietic Stem Cell Transplantation
- Lung Cancer
- Breast Cancer
- Prostate Cancer
- Colorectal Cancer
- Pancreatic Tumors
- Other Solid Tumors
- Immunotherapy & Cellular Therapy
- Oncologic Emergencies
- Chemo Side Effects
- INFECTIOUS DISEASES
- ENDOCRINOLOGY
-
RHEUMATOLOGY
- Approach to Rheumatic Disease
- Rheumatoid Arthritis
- Adult-Onset Still’s Disease & Relapsing Polychondritis
- Crystal Deposition Arthritides
- Seronegative Spondyloarthritis
- Infectious Arthritis & Bursitis
- Connective Tissue Diseases
- Systemic Lupus Erythematosus
- IgG4-Related Disease
- Vasculitis
- Autoinflammatory Syndromes
- Amyloidosis
- NEUROLOGY
- CONSULTS
- APPENDIX
- ABBREVIATIONS
- INDEX
- PHOTO INSERTS
- ACLS